
二级缓存值得吗?
有人说:Redis 已经够快了,还加二级缓存做什么?
其实,二级缓存的主要目的不是为了让已经很快的接口变得更快,而是为了减轻 Redis 的压力,尤其是当系统面对脉冲型热点,或出现热 key 时,为了提升系统的稳定性,二级缓存就非常管用。
热 key 是怎么来的?
电商大促期间,某些商品会突然变得很热门,短时间内会有大量的用户同时频繁访问,如果你的商品详情接口未加二级缓存,那么这些请求会直接打到 Redis,造成 Redis 中热 key 的产生。
热 key 有什么危害?
要知道 Redis 单实例 QPS 上限为 10万,如果某个 key 的 QPS 为 1万,那就占用了 10% 的实例处理能力,若该 key 的访问量继续激增,可能造成 Redis 单节点 CPU 和带宽瓶颈,进而导致实例上其他 key 的访问延迟。
怎么发现热 key?
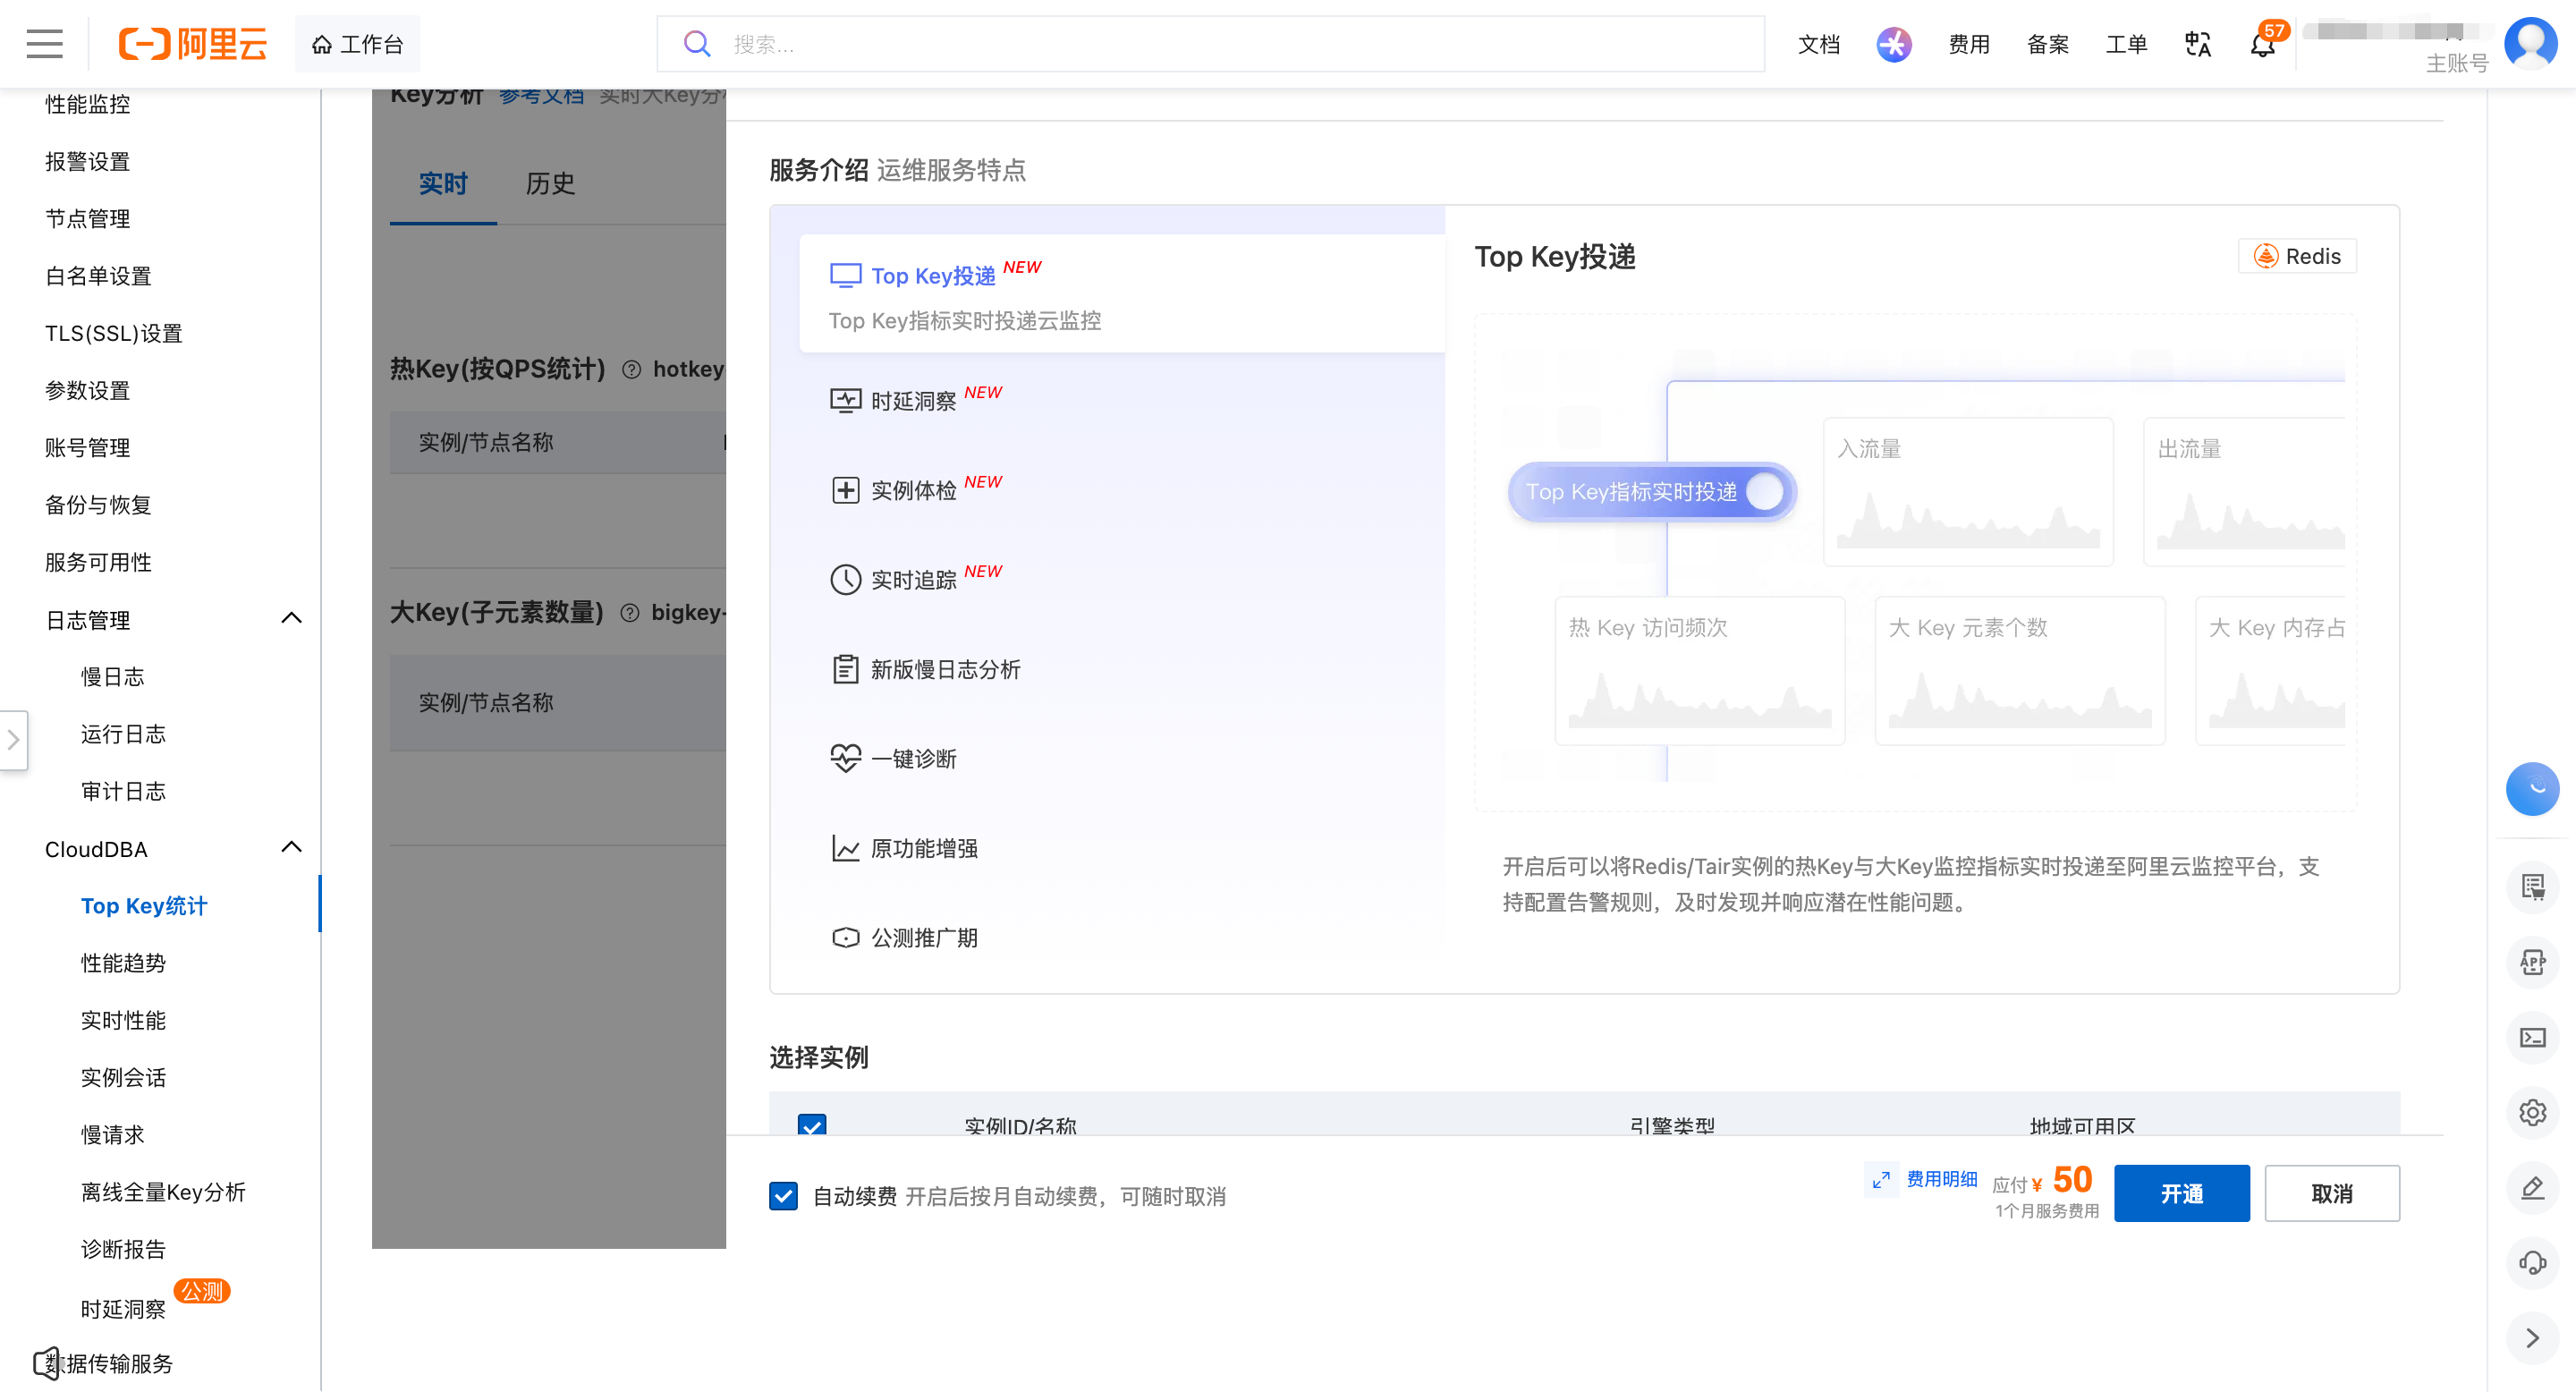
使用云服务的 Top Key 统计功能
如果你使用的是公有云 Redis 服务的话,一般都会提供 Top Key 统计功能,阿里云还支持配置热 key 的告警规则,当产生热 key 时,能及时告警。
redis-cli --hotkeys 命令
在 Redis 4.0+ 中,你也可以通过 redis-cli --hotkeys 命令来分析,前提是 Redis 实例必须开启 LFU 淘汰策略(volatile-lfu 或 allkeys-lfu),但不建议在生产业务高峰期执行。
语法:
redis-cli -u redis://user:pass@host:port --hotkeys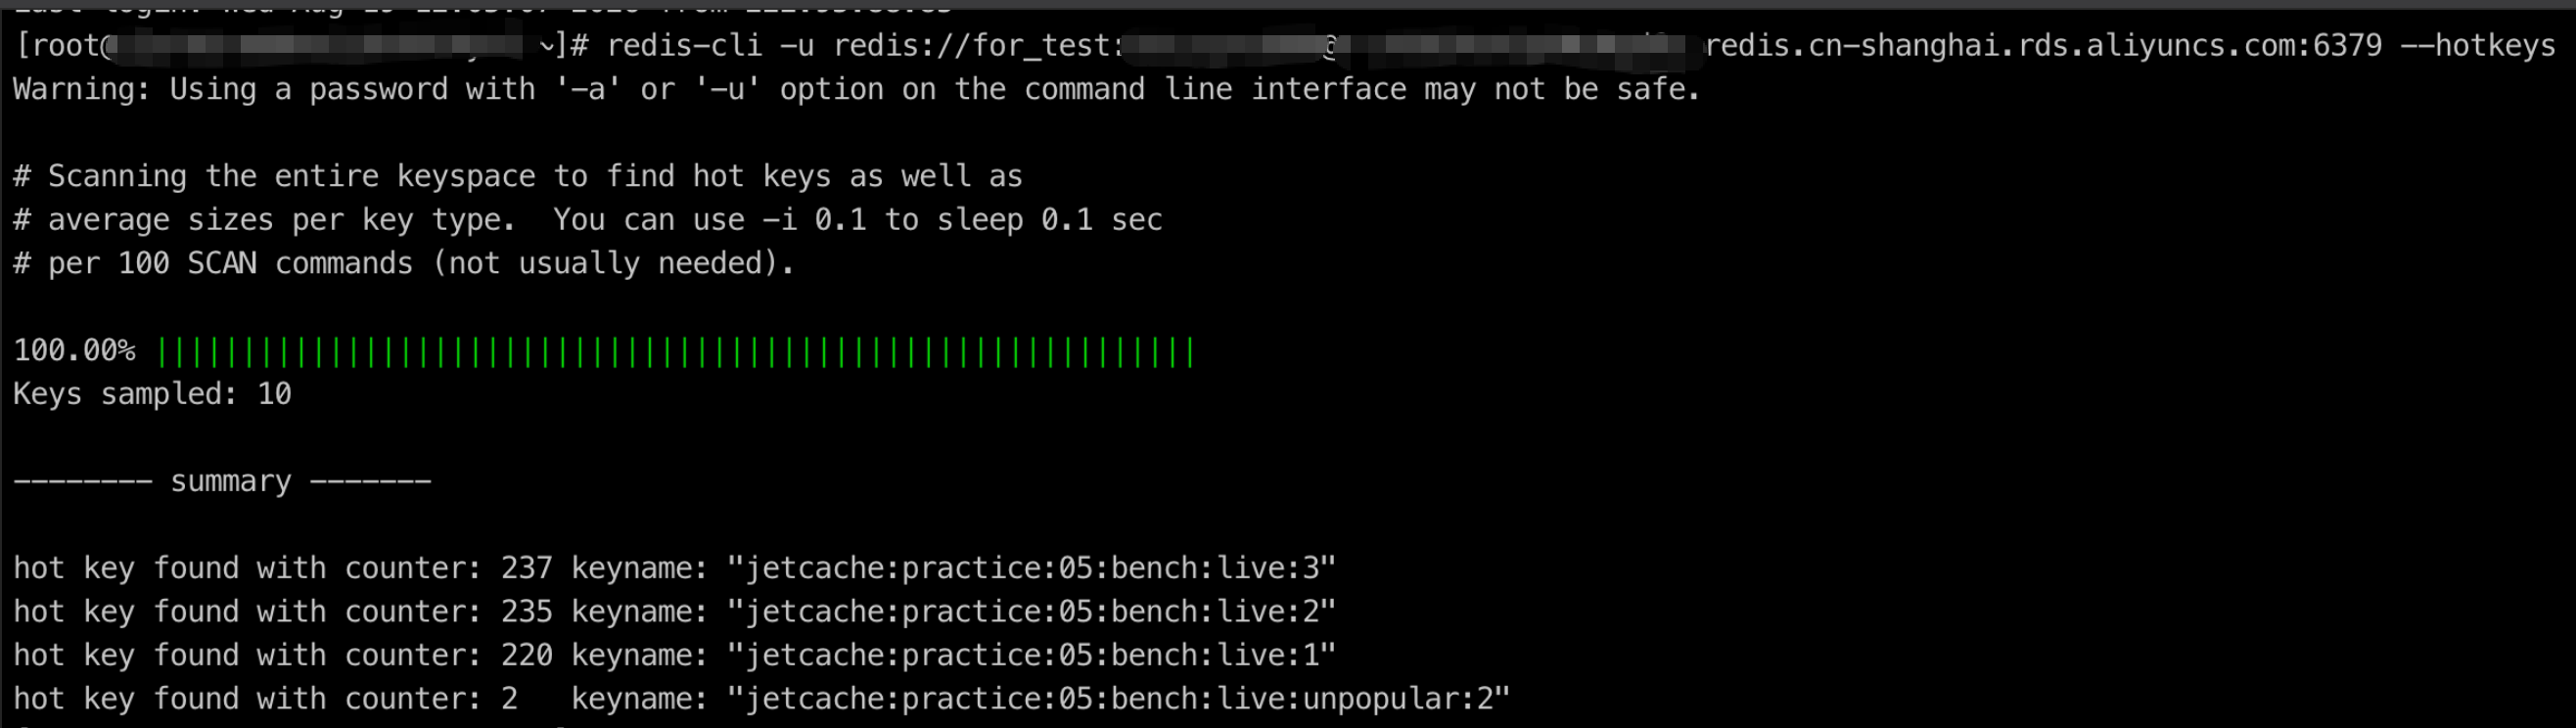
生产更稳妥的执行方式是加 -i 0.1 参数,每执行 100 次 SCAN 就暂停 0.1 秒。
redis-cli -u redis://user:pass@host:port --hotkeys -i 0.1HOTKEYS 命令
Redis 8.6.0 起,可以使用 HOTKEYS 命令
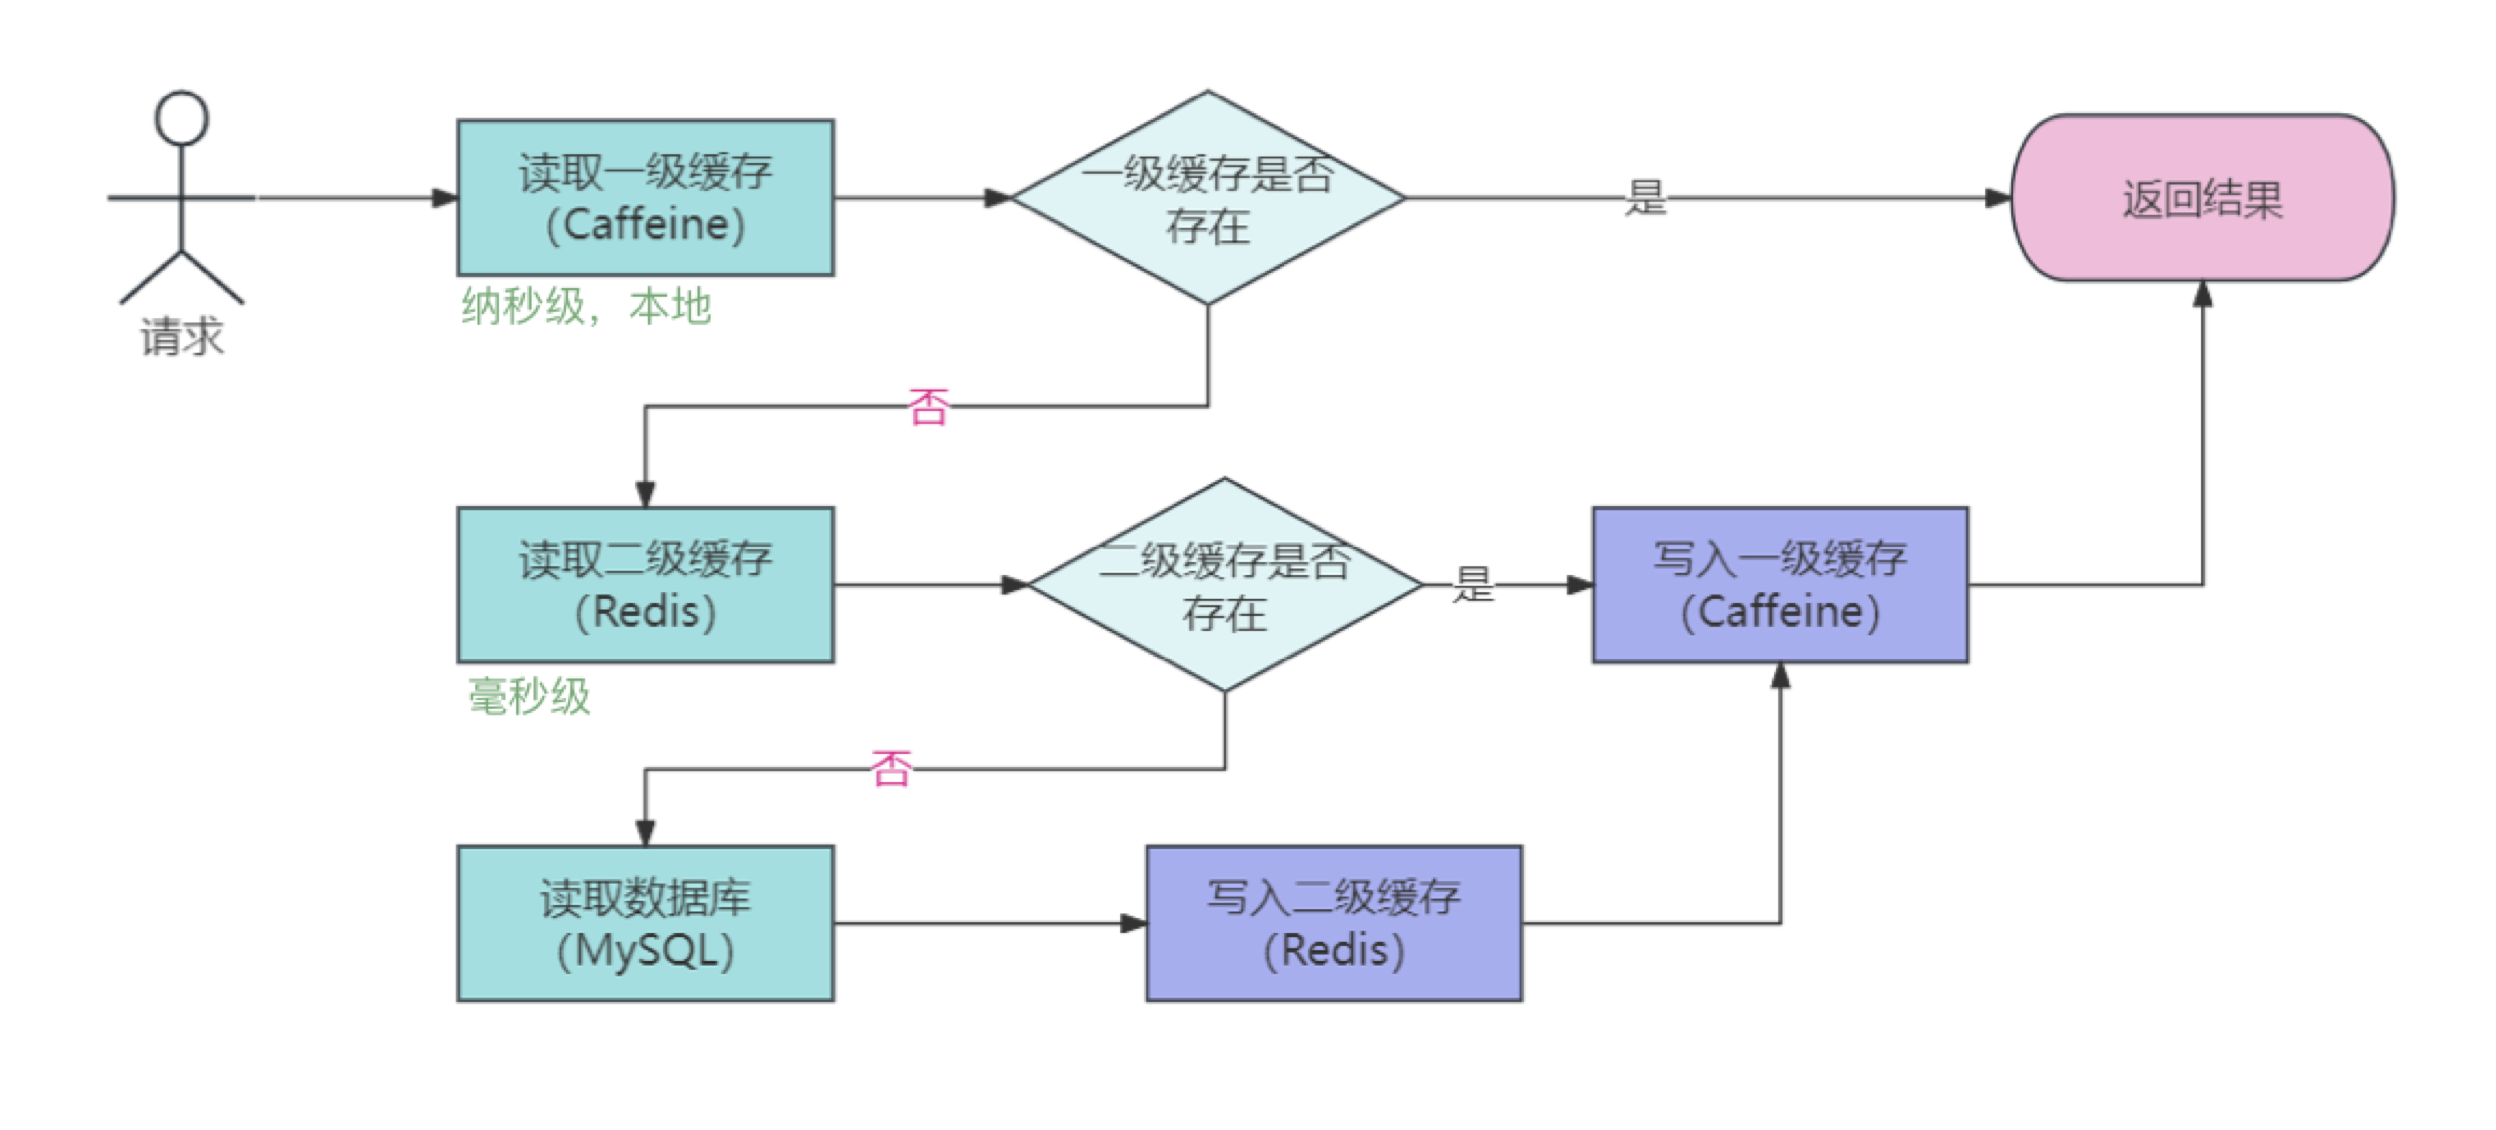
二级缓存架构
示例代码
Redis Pub/Sub 配置:
@Configuration
public class RedisPubSubConfig {

    @Bean
    public RedisMessageListenerContainer redisMessageListenerContainer(
            RedisConnectionFactory connectionFactory) {
        RedisMessageListenerContainer container = new RedisMessageListenerContainer();
        container.setConnectionFactory(connectionFactory);
        return container;
    }
}
读路径和写路径的实现:
@Component
@RequiredArgsConstructor
public class CacheInvalidationBroadcastDemoImpl {

    private static final String CHANNEL = "practice:04:invalidation";

    private final StringRedisTemplate stringRedisTemplate;

    private final RedisMessageListenerContainer listenerContainer;

    private final ConcurrentHashMap<String, String> db = new ConcurrentHashMap<>();

    private final ConcurrentHashMap<String, Cache<String, String>> l1ByNode = new ConcurrentHashMap<>();

    @Override
    public void registerNode(String nodeName) {
        if (l1ByNode.containsKey(nodeName)) {
            return;
        }

        // 初始化 Caffeine 本地缓存(L1)
        Cache<String, String> l1 = Caffeine.newBuilder()
                .expireAfterWrite(Duration.ofSeconds(60))
                .maximumSize(10_000)
                .build();

        if (l1ByNode.putIfAbsent(nodeName, l1) == null) {
            // 订阅失效广播频道
            listenerContainer.addMessageListener((message, pattern) -> {
                String key = new String(message.getBody(), StandardCharsets.UTF_8);
                l1.invalidate(key);
            }, new ChannelTopic(CHANNEL));
        }
    }

    @Override
    public String read(String nodeName, String key) {
        Cache<String, String> l1 = l1ByNode.get(nodeName);
        if (l1 == null) {
            throw new IllegalStateException("Node not registered: " + nodeName);
        }

        // 读 L1
        String value = l1.getIfPresent(key);
        if (value != null) {
            return value;
        }

        // 读 L2
        value = stringRedisTemplate.opsForValue().get(key);
        if (value != null) {
            l1.put(key, value);
            return value;
        }

        // 读 DB
        value = loadFromSource(key);
        if (value != null) {
            // 写 L2
            stringRedisTemplate.opsForValue().set(key, value, Duration.ofSeconds(300));
            // 写 L1
            l1.put(key, value);
        }
        return value;
    }

    @Override
    public void write(String nodeName, String key, String value) {
        Cache<String, String> l1 = l1ByNode.get(nodeName);
        if (l1 == null) {
            throw new IllegalStateException("Node not registered: " + nodeName);
        }

        // 写 DB
        saveToSource(key, value);
        // 删 L2
        stringRedisTemplate.delete(key);
        // 删 L1
        l1.invalidate(key);
        // 通知 L1 失效
        stringRedisTemplate.convertAndSend(CHANNEL, key);
    }

    @Override
    public String getFromL1(String nodeName, String key) {
        Cache<String, String> l1 = l1ByNode.get(nodeName);
        if (l1 == null) {
            throw new IllegalStateException("Node not registered: " + nodeName);
        }
        return l1.getIfPresent(key);
    }

    @Override
    public String loadFromSource(String key) {
        return db.get(key);
    }

    @Override
    public void saveToSource(String key, String value) {
        db.put(key, value);
    }
}
以上示例代码仅演示二级缓存的实现逻辑,实际开发中推荐使用阿里开源的 jetcache,类似 Spring Cache 但使用更灵活。
案例准备
以直播业务为例,我们在单机 10,000 QPS 的场景下,对"获取直播间推荐商品"接口进行 A/B 对照测试:分别在仅启用 Redis 缓存和开启二级缓存两种配置下,观察性能差异。
获取直播间推荐商品接口:
A 组代码片段(仅启用 Redis 缓存):
@Cached(name = "practice:05:bench:live:", key = "#roomId", expire = 3600, cacheNullValue = true)
@CachePenetrationProtect
public String getLiveProduct(Long roomId) {
    try {
        // 模拟 DB 查询延迟
        Thread.sleep(50);
    } catch (InterruptedException e) {
        Thread.currentThread().interrupt();
    }
    return db.get(roomId);
}
B 组代码片段(开启二级缓存):
@Cached(name = "practice:05:bench:live:", key = "#roomId", expire = 3600, cacheNullValue = true,
            cacheType = CacheType.BOTH, localLimit = 100, localExpire = 60, syncLocal = true)
@CachePenetrationProtect
public String getLiveProduct(Long roomId) {
    try {
        // 模拟 DB 查询延迟
        Thread.sleep(50);
    } catch (InterruptedException e) {
        Thread.currentThread().interrupt();
    }
    return db.get(roomId);
}
同时提供另外两个接口:
- 清除直播间推荐商品缓存(模拟商品信息变更场景)
- 查询冷门商品(模拟 Redis 背景流量)
压测
环境
Mac1:
- 系统:macOS Monterey 12.7.6
- CPU:2.2 GHz 四核 Intel Core i7
- 内存:16 GB 1600 MHz DDR3
- 网络:有线以太网
- 监控栈:Docker 跑 Prometheus(监控 Mac2 的 Spring Boot 应用和本地 RedisExporter),Grafana,RedisExporter(公网连阿里云 Redis, 延迟约 19 ms)
Mac2:
- 系统:macOS Tahoe 26.5.1
- CPU:8核(4性能和4能效)Apple M3
- 内存:16 GB
- 网络:有线以太网
- 应用:跑 Spring Boot 应用(-Xms2g -Xmx2g,公网连阿里云 Redis,延迟约 19 ms)+ JMeter 本地压测
Mac1 和 Mac2 通过有线连接同一局域网,网络延迟约 1 ms。
JMeter 测试计划
模拟一场直播,持续 5 分钟
热门商品观众: 大约每隔 50 毫秒查询一次直播间推荐商品
助理: 1 人,大约每隔 2 分钟清理一次直播间推荐商品的缓存
冷门商品观众: 大约每隔 2 秒查询一次冷门商品
recommend-product-mixed-test:
  热门商品观众线程组: 持续5分钟
    - 定时50毫秒(浮动5毫秒)
    - 获取直播间推荐商品
  助理线程组: 1个用户,1秒爬坡,持续5分钟
    - 定时2分钟(浮动1秒)
    - 清除直播间推荐商品缓存
  冷门商品观众线程组: 持续5分钟
    - 定时2秒(浮动200毫秒)
    - 查询冷门商品
低负载压测
目的: 为了初步评估业务的平均处理时长
JMeter 线程组用户数设定:
- 热门商品观众线程组: 1
- 助理线程组: 1
- 冷门商品观众线程组: 1
执行测试计划:
jmeter -n -t recommend-product-mixed-test.jmx -l result_$(date +%Y%m%d_%H%M).jtl -e -o report_$(date +%Y%m%d_%H%M) -f生成的 JMeter 报告:
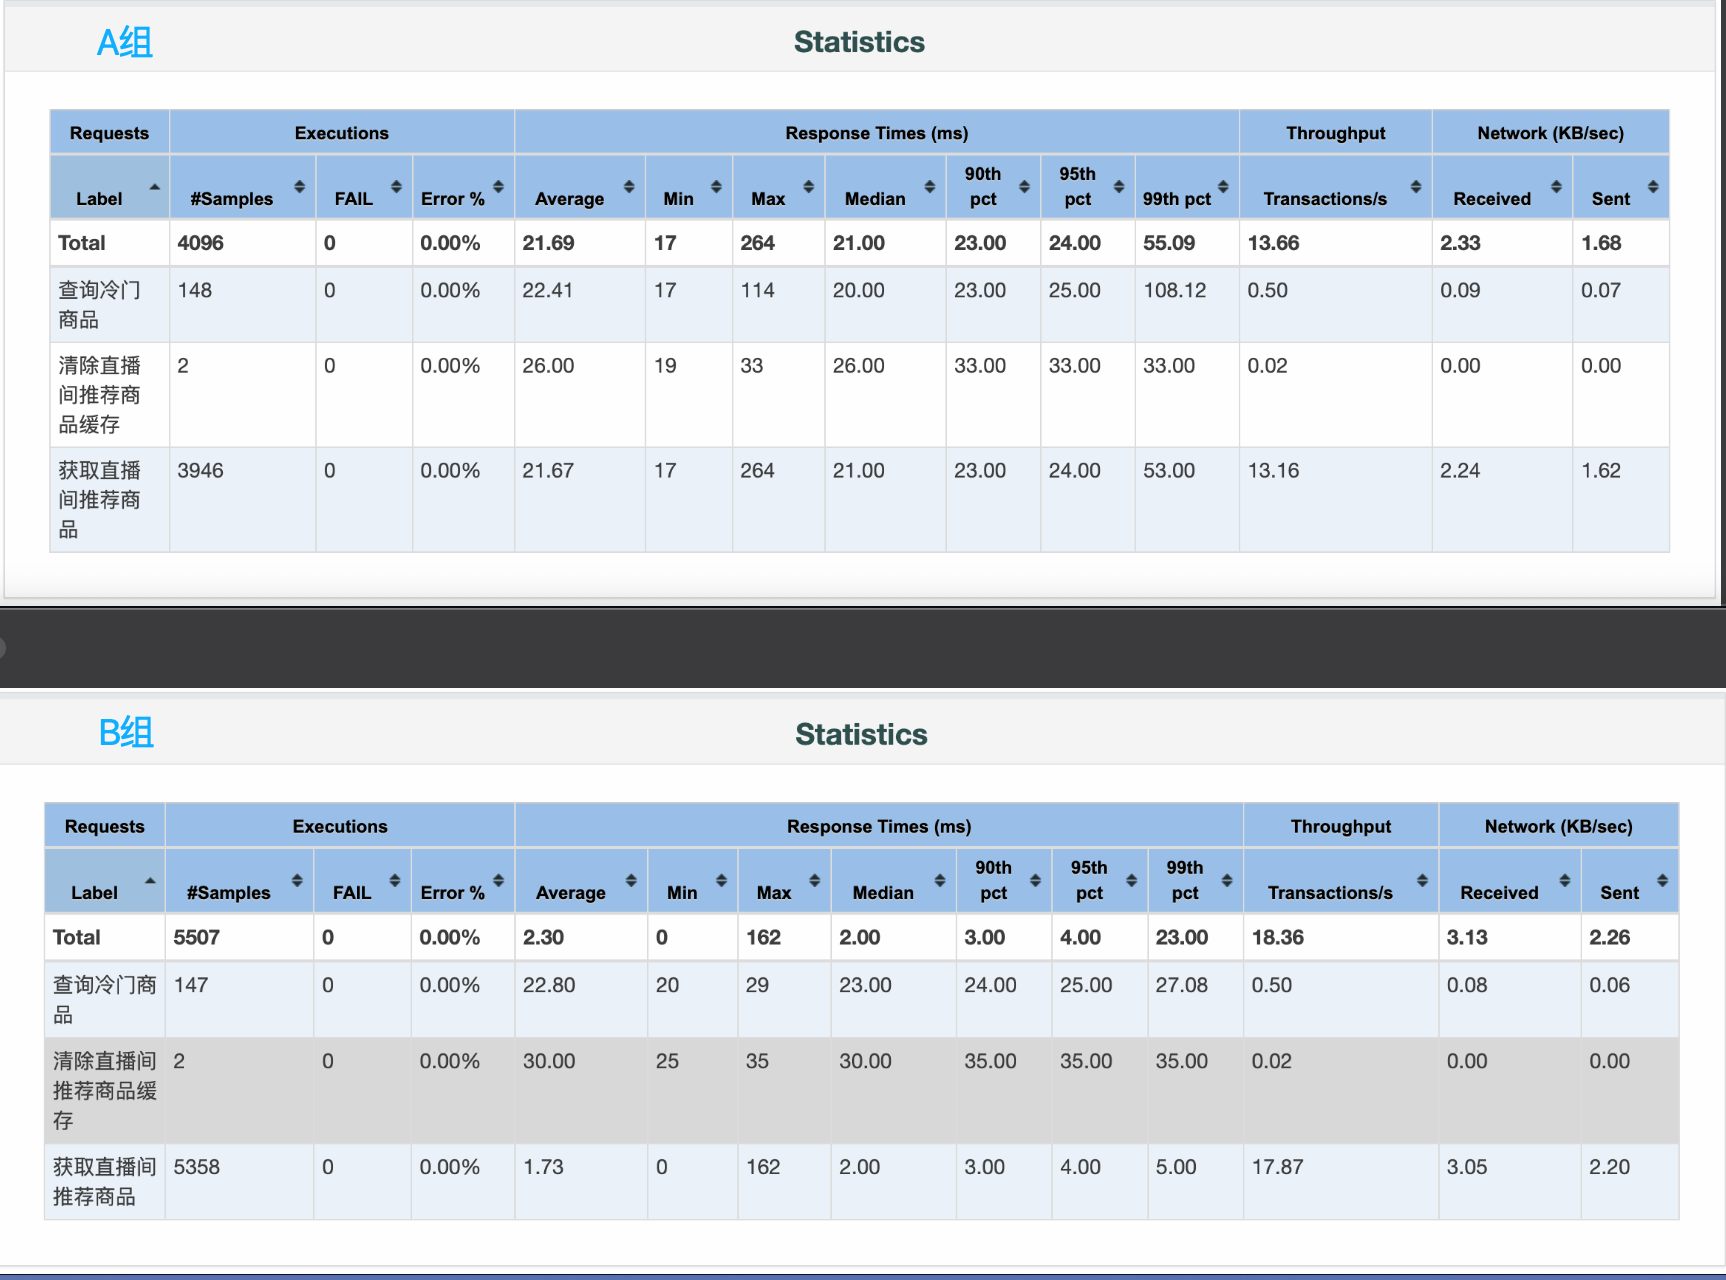
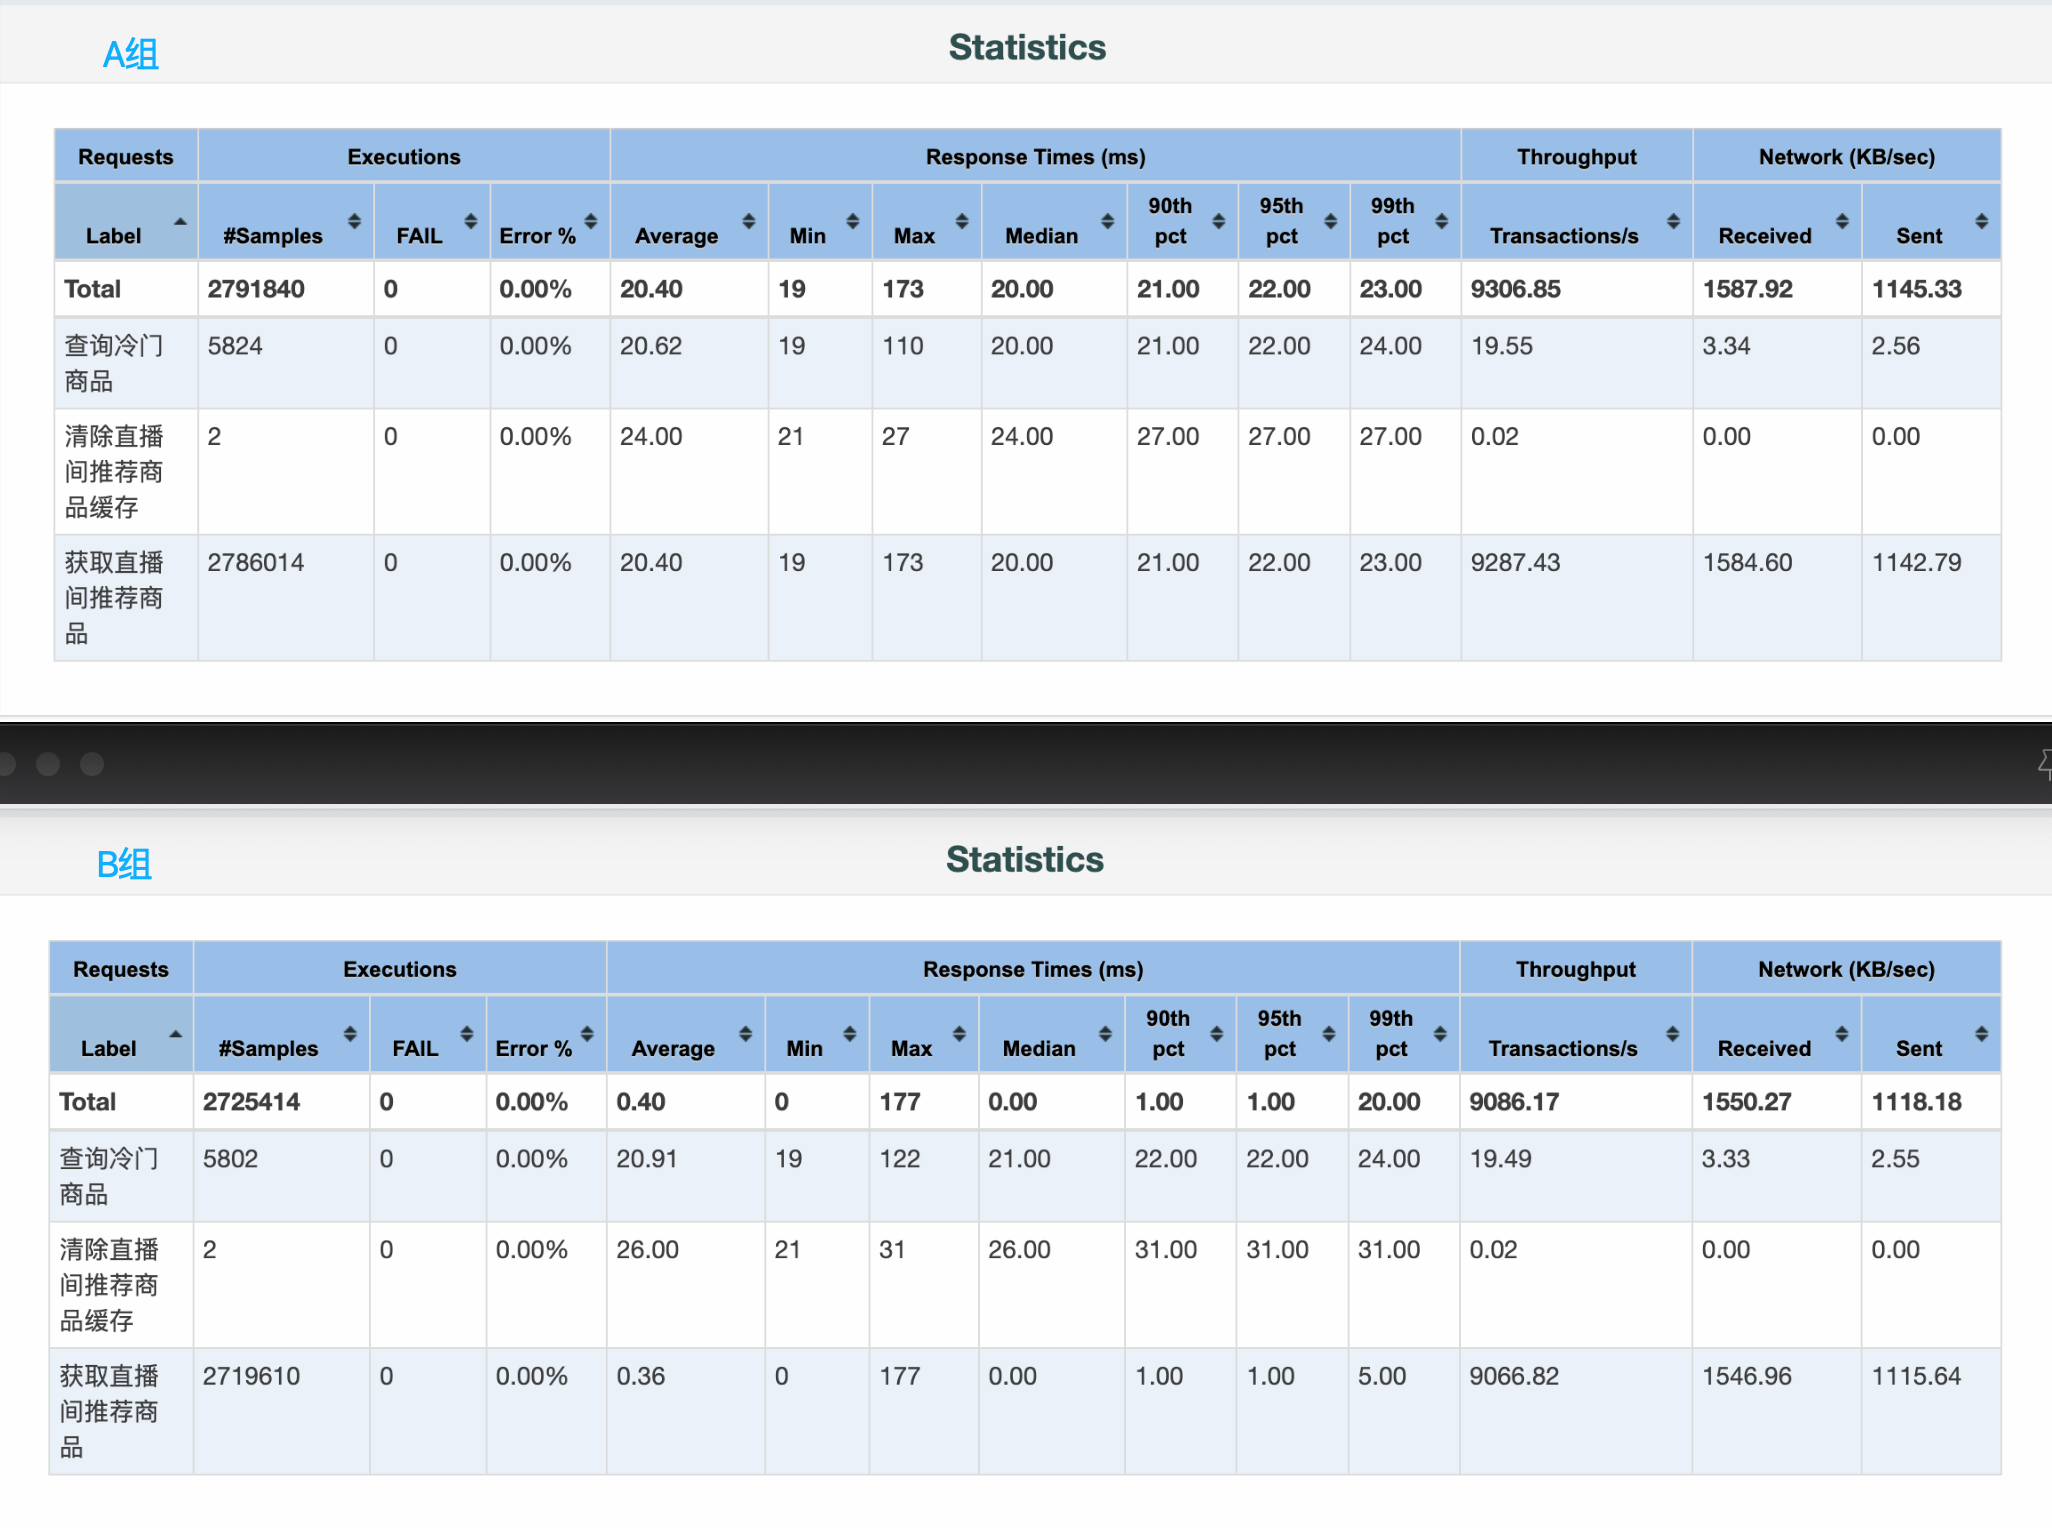
A 组业务的平均处理时长约为: 21 ms
B 组业务的平均处理时长约为: 2.3 ms
提示
低负载下,请求几乎不会在 Tomcat 线程池等待,JMeter 压测出的平均响应时间可近似作为业务的平均处理时长,即排队论中的 1/μ。
排队论模拟
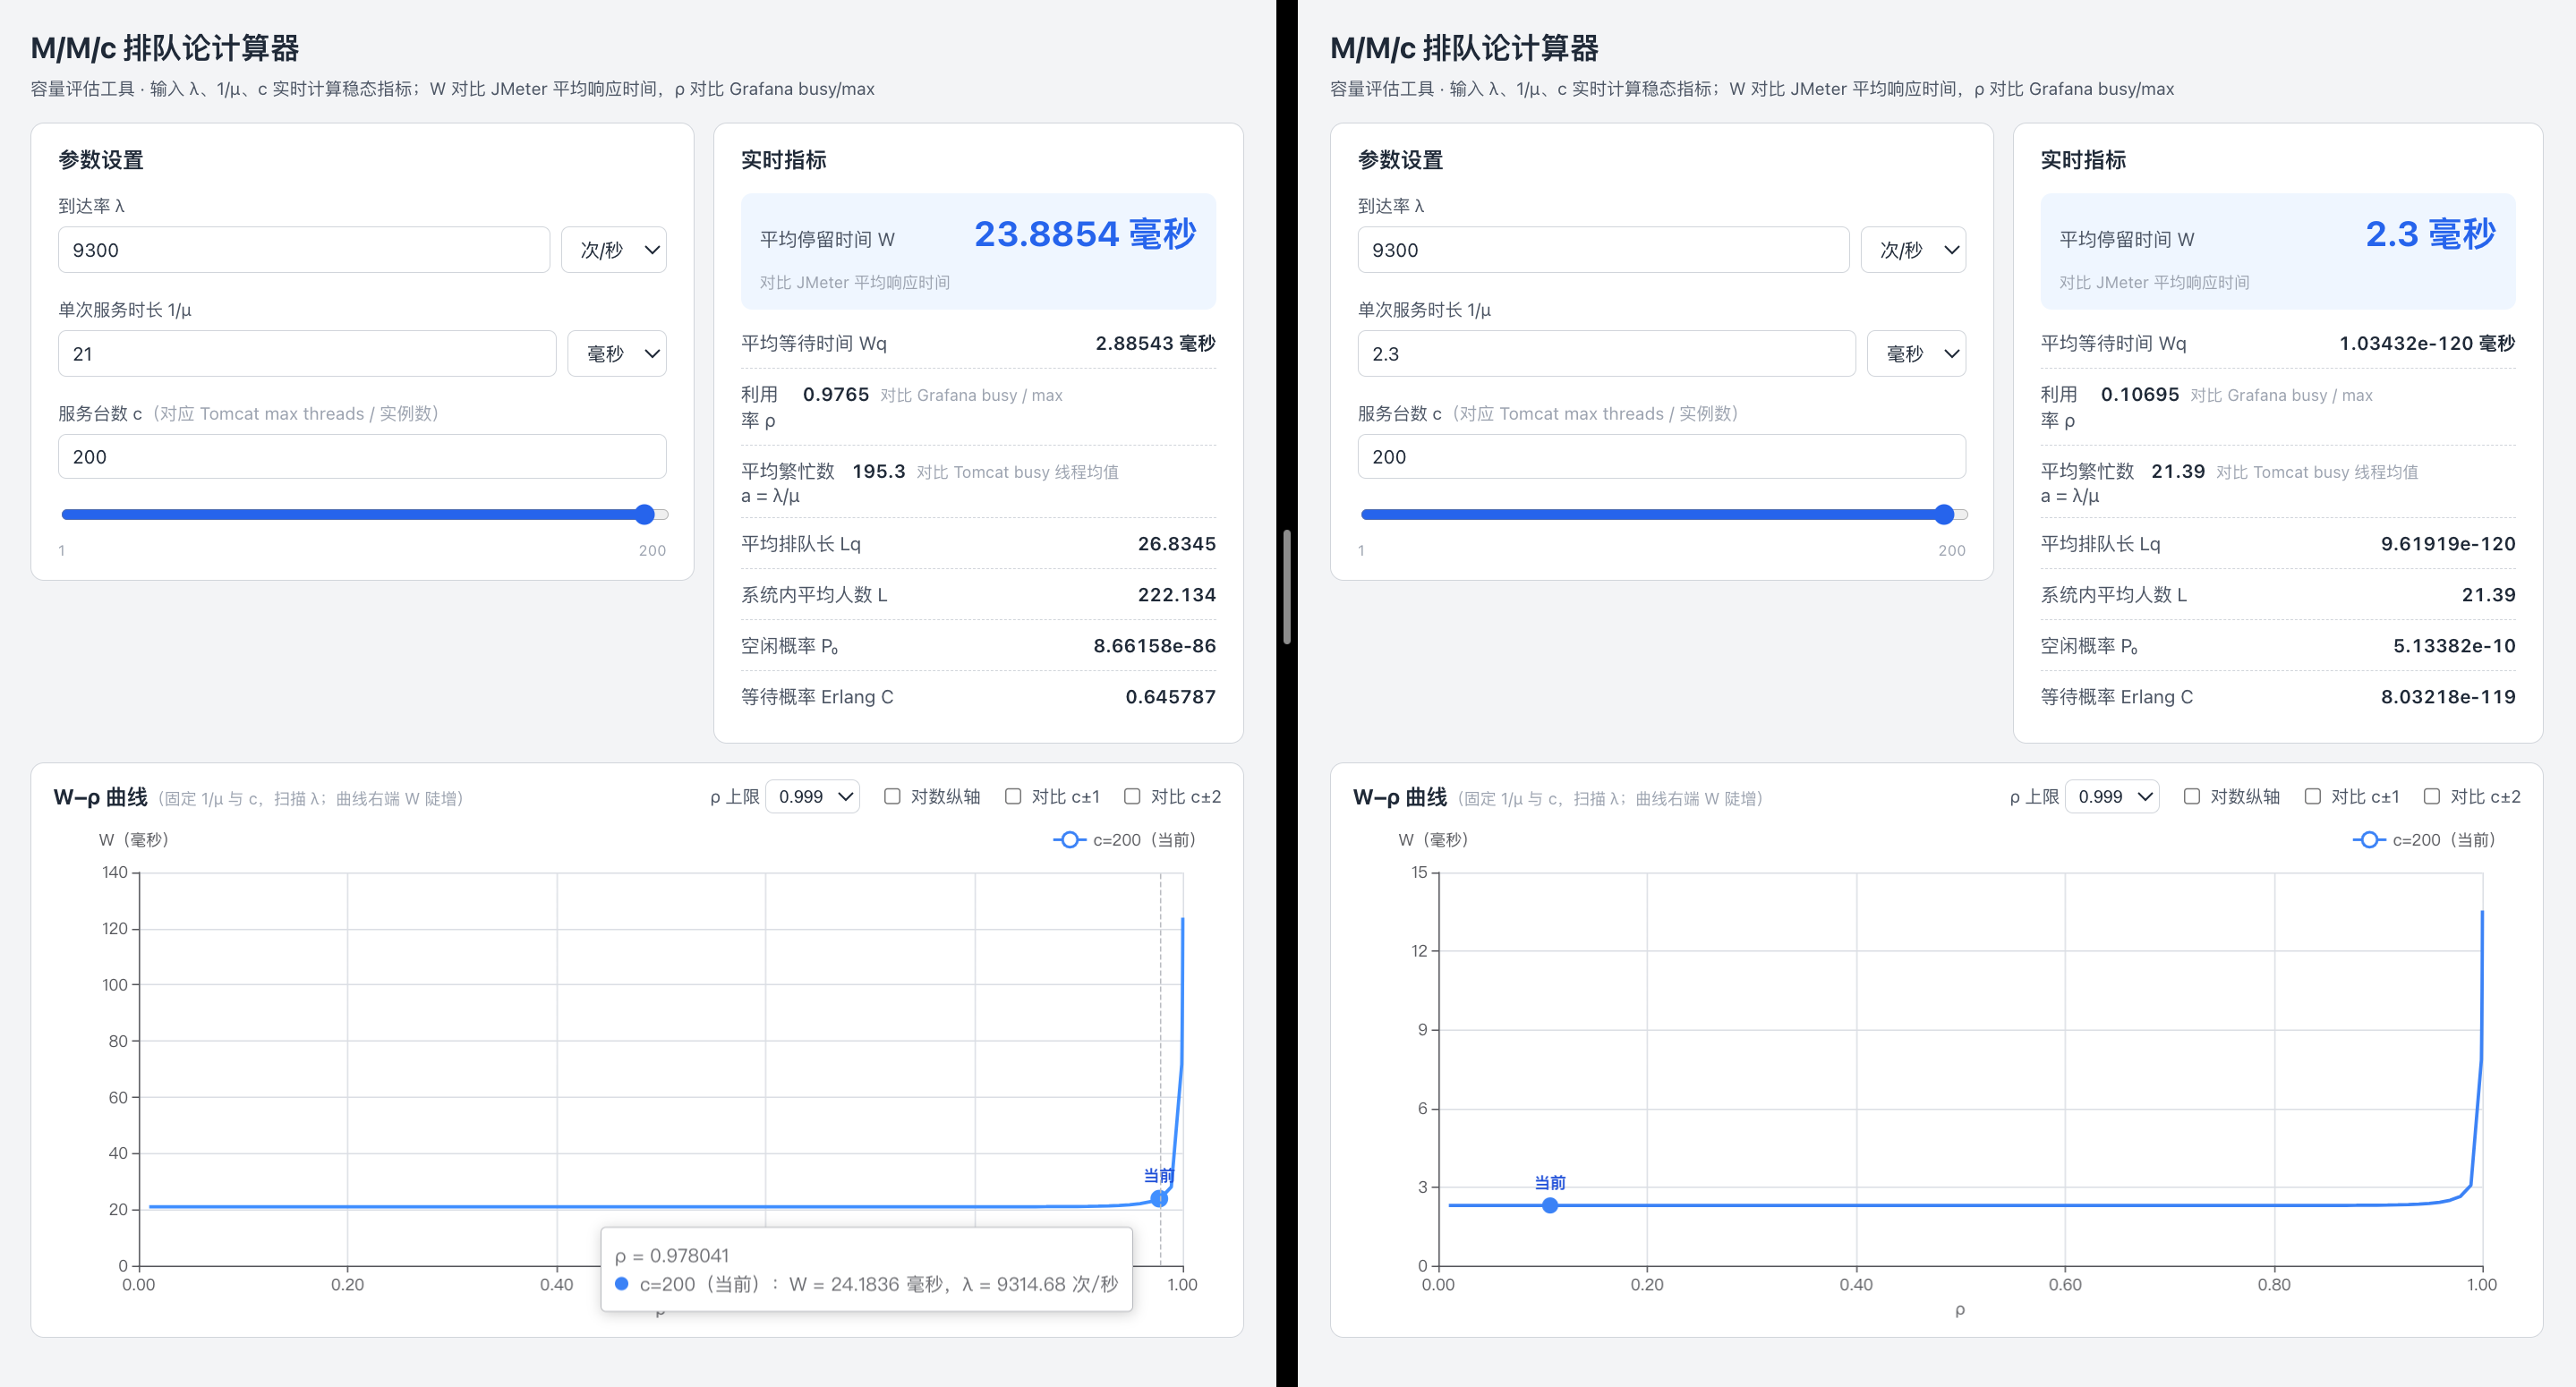
A / B 组 Tomcat 最大线程数都是 200,即 c = 200;A 组 1/μ = 21ms,B 组 1/μ = 2.3ms
分别代入 M/M/c 排队论计算器,得出: 当 QPS 为 9300 时,A 组平均等待时间不会陡增;B 组利用率仅 10.695%,还有较大余量,几乎不用等待。综合之下取 9300 作为两组压测的目标 QPS。
A 组平均停留时间 W = 23.8854 ms
B 组平均停留时间 W = 2.3 ms
相同 QPS 负载下,分别调整 A/B 组 JMeter 线程数
9300 QPS 中,20 QPS 作为冷门商品的流量(模拟 Redis 背景流量),9280 QPS 作为热门商品的流量。
由 Little's Law 公式:
可以推导出:
由此计算得出:
A 组:
热门商品观众数
冷门商品观众数
B 组:
热门商品观众数
冷门商品观众数
调整后的测试计划:
# A 组测试计划
recommend-product-mixed-test:
  热门商品观众线程组: 686个用户,10秒爬坡,持续5分钟
    - 定时50毫秒(浮动5毫秒)
    - 获取直播间推荐商品
  助理线程组: 1个用户,1秒爬坡,持续5分钟
    - 定时2分钟(浮动1秒)
    - 清除直播间推荐商品缓存
  冷门商品观众线程组: 40个用户,10秒爬坡,持续5分钟
    - 定时2秒(浮动200毫秒)
    - 查询冷门商品

# B 组测试计划
recommend-product-mixed-test:
  热门商品观众线程组: 486个用户,10秒爬坡,持续5分钟
    - 定时50毫秒(浮动5毫秒)
    - 获取直播间推荐商品
  助理线程组: 1个用户,1秒爬坡,持续5分钟
    - 定时2分钟(浮动1秒)
    - 清除直播间推荐商品缓存
  冷门商品观众线程组: 40个用户,10秒爬坡,持续5分钟
    - 定时2秒(浮动200毫秒)
    - 查询冷门商品
依次进行 A/B 压测,观察应用、Redis 各项指标
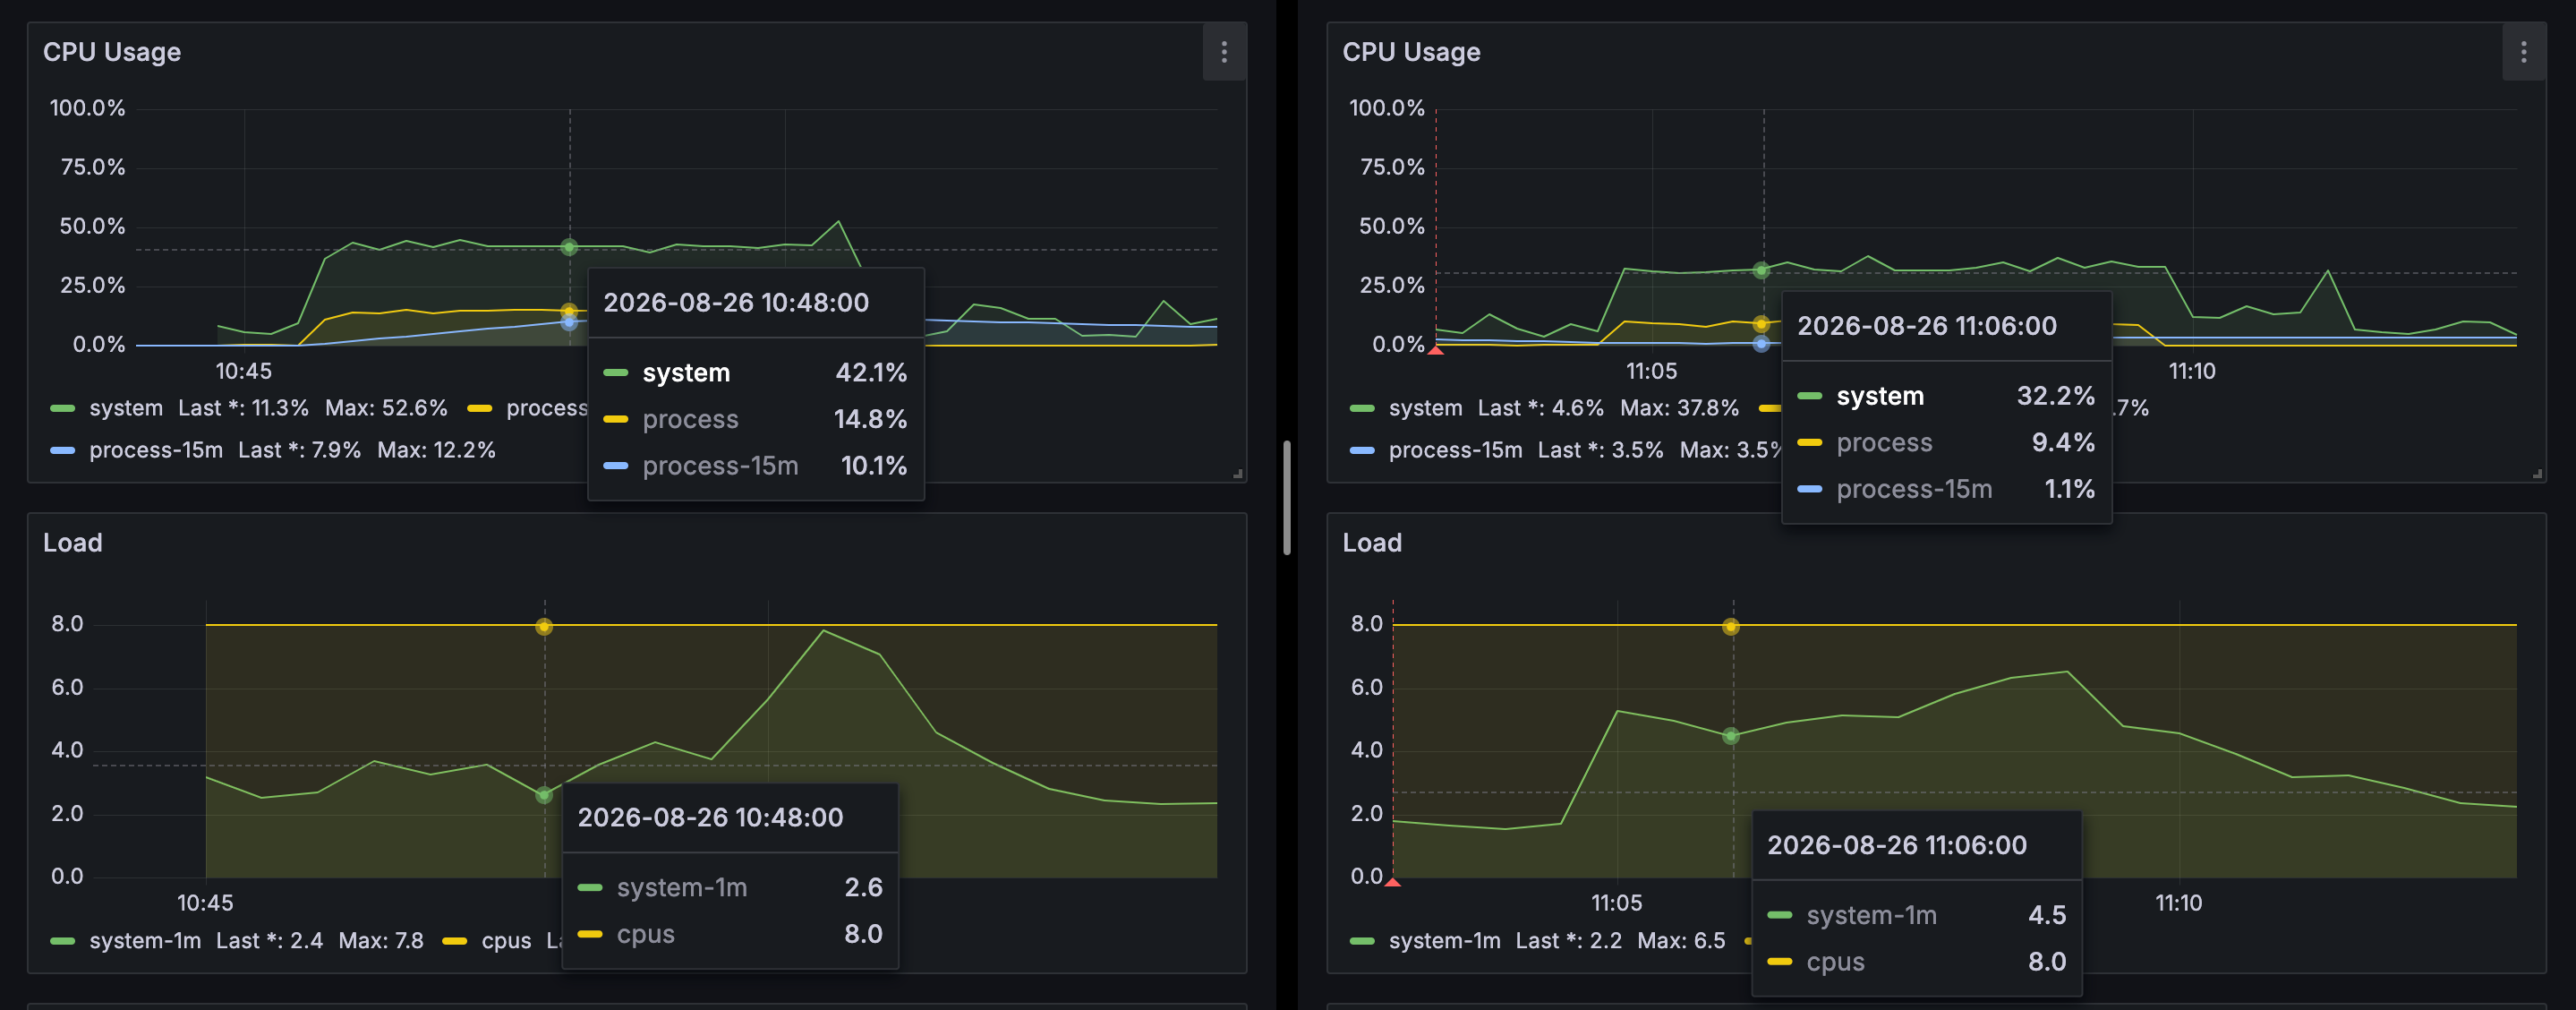
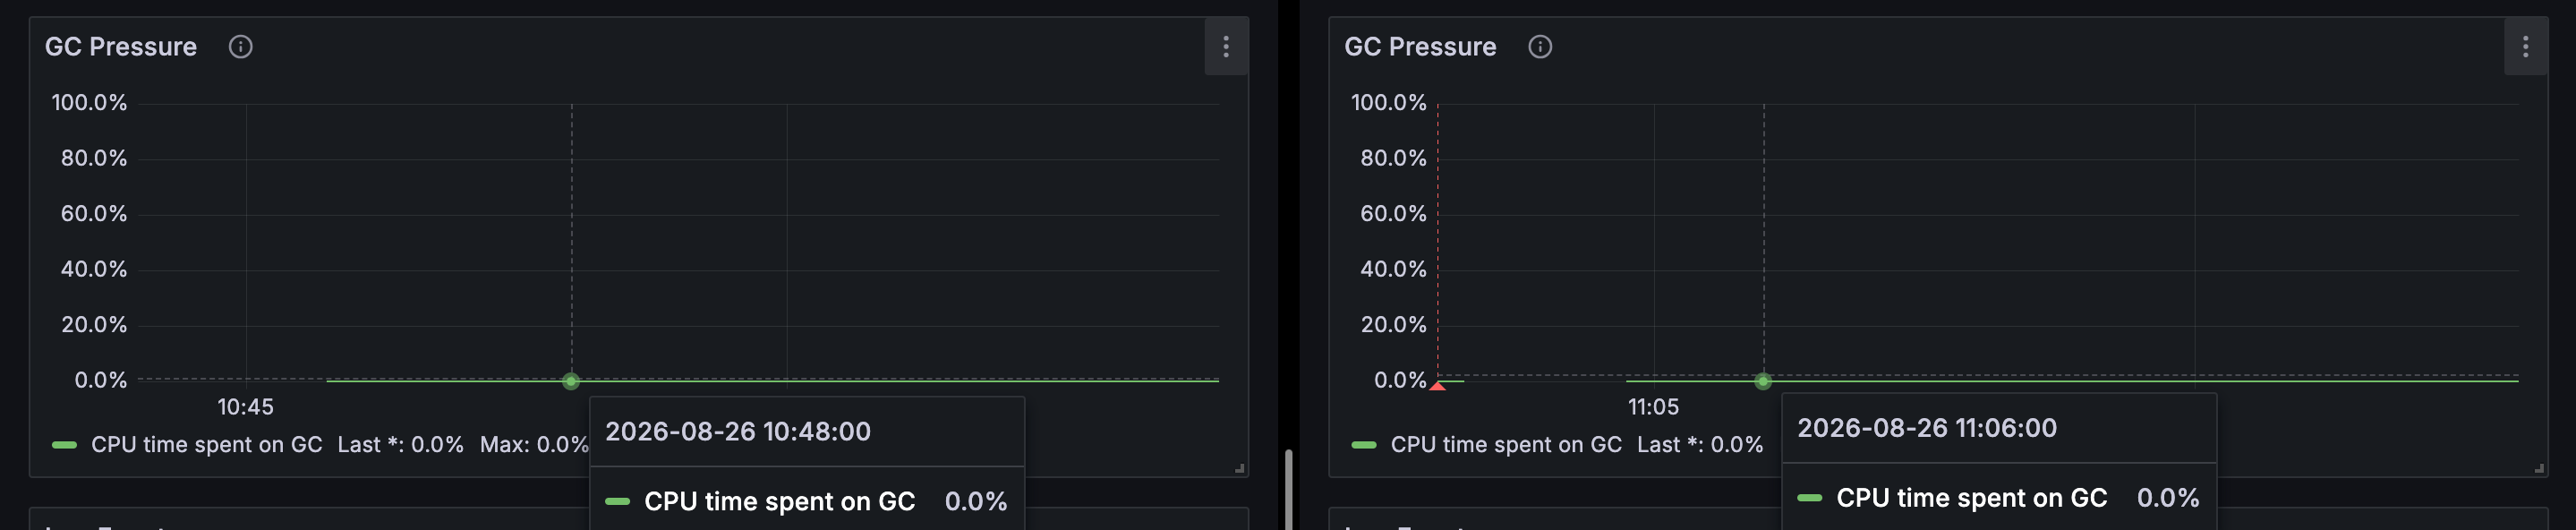
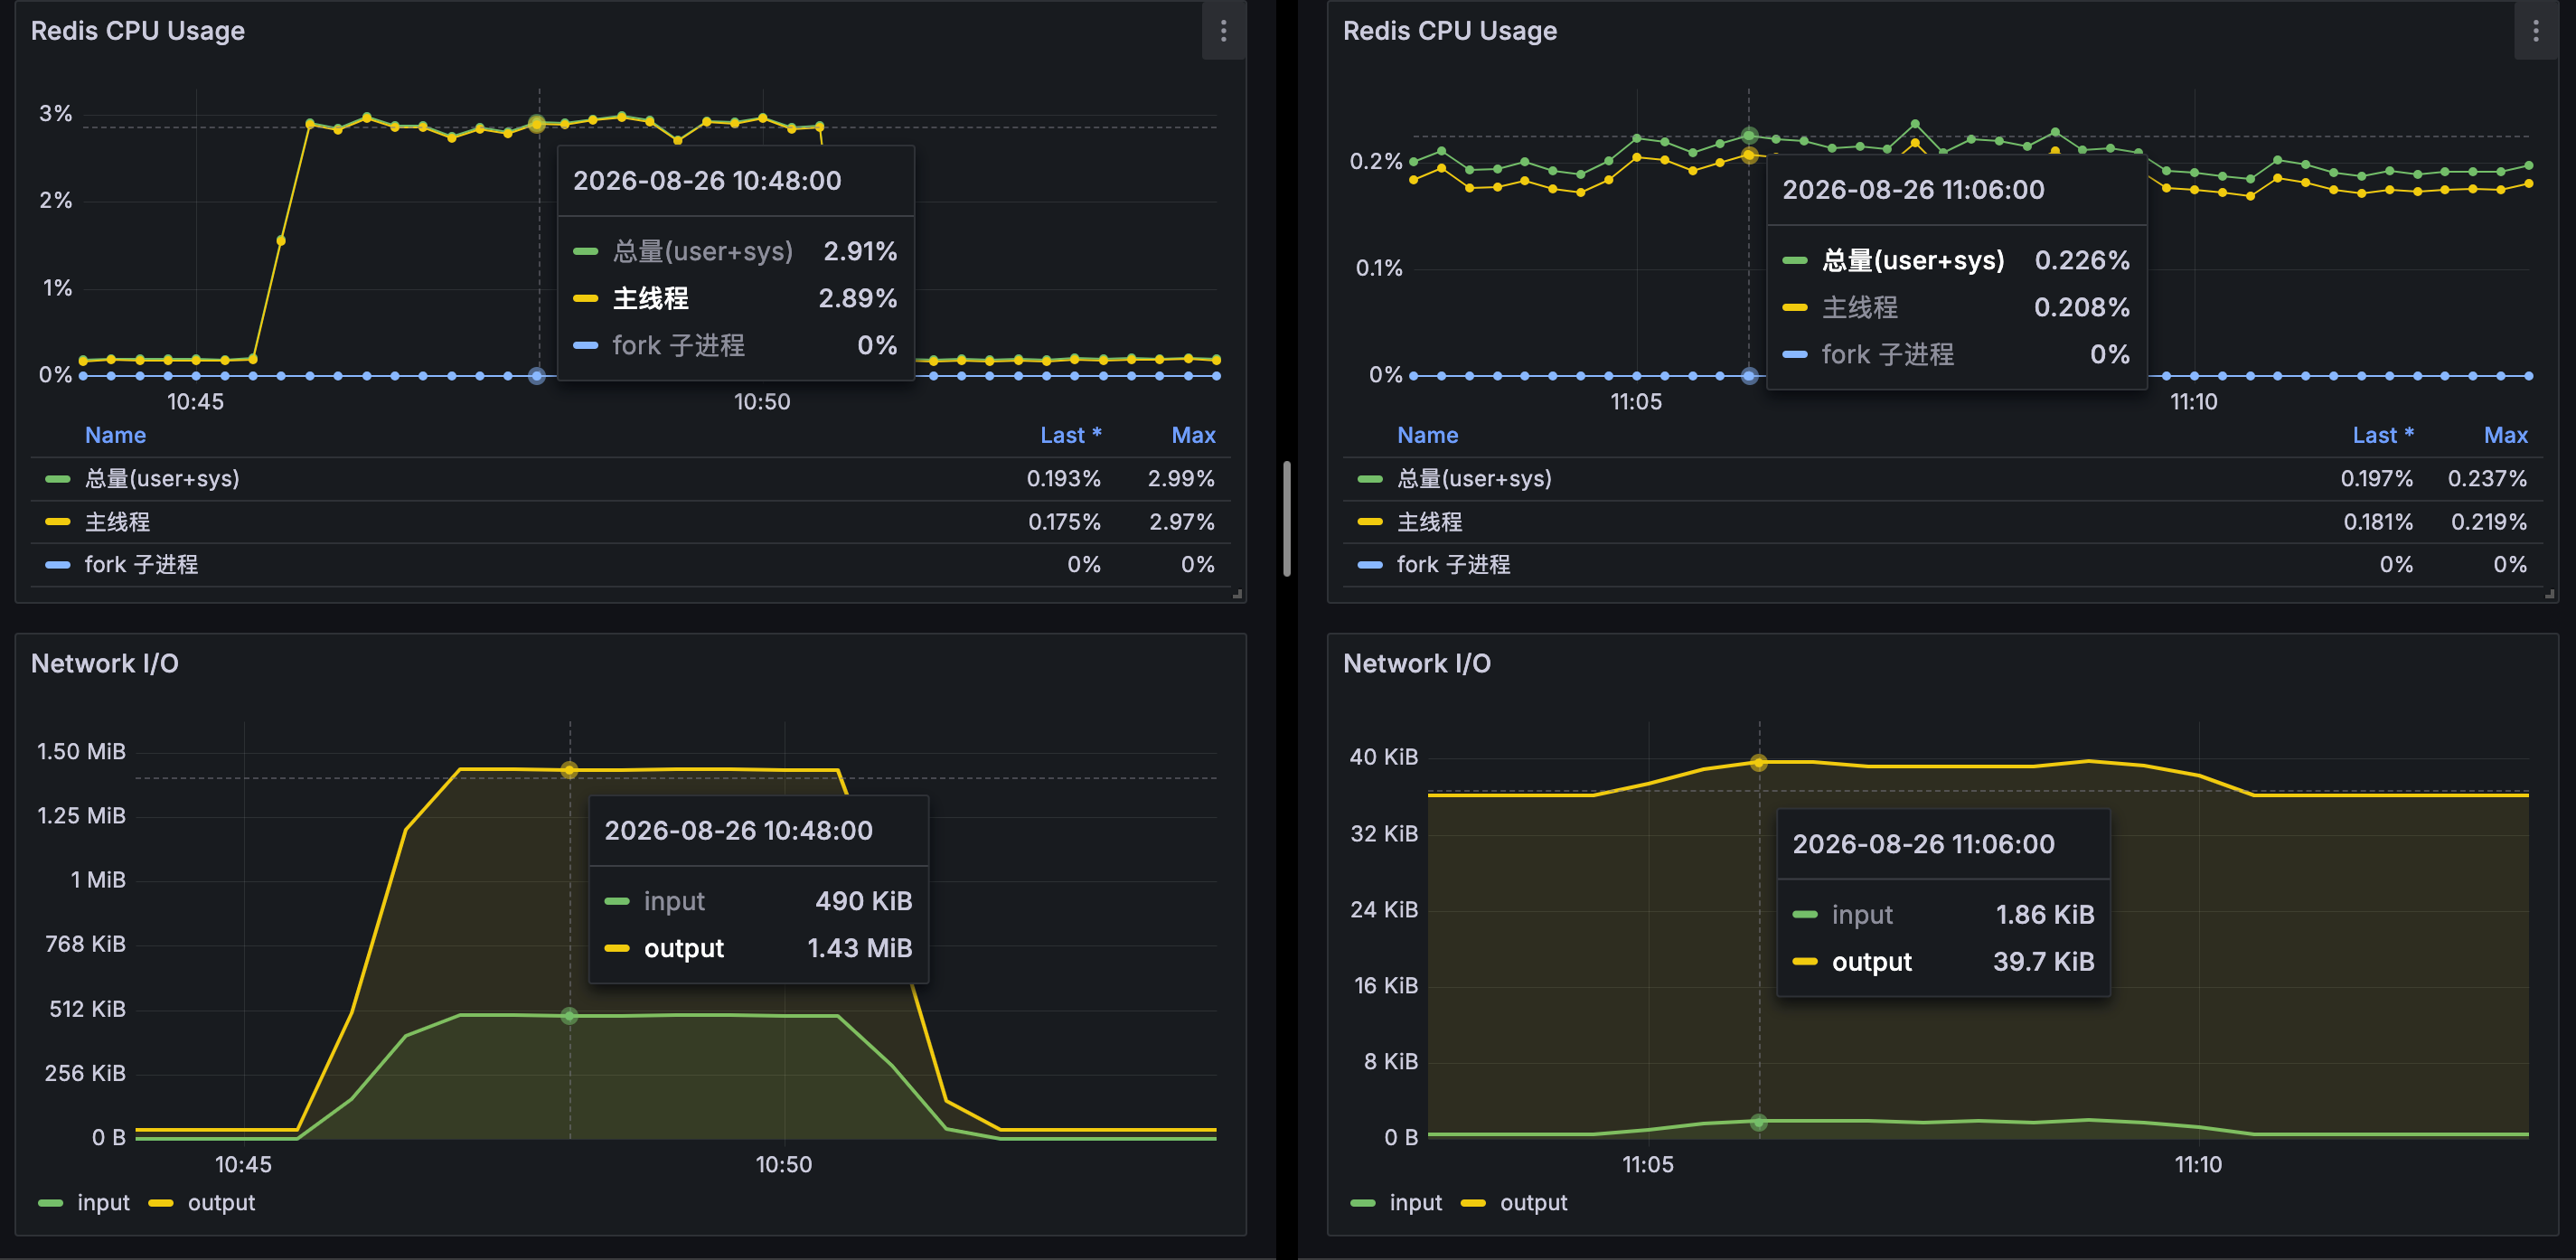
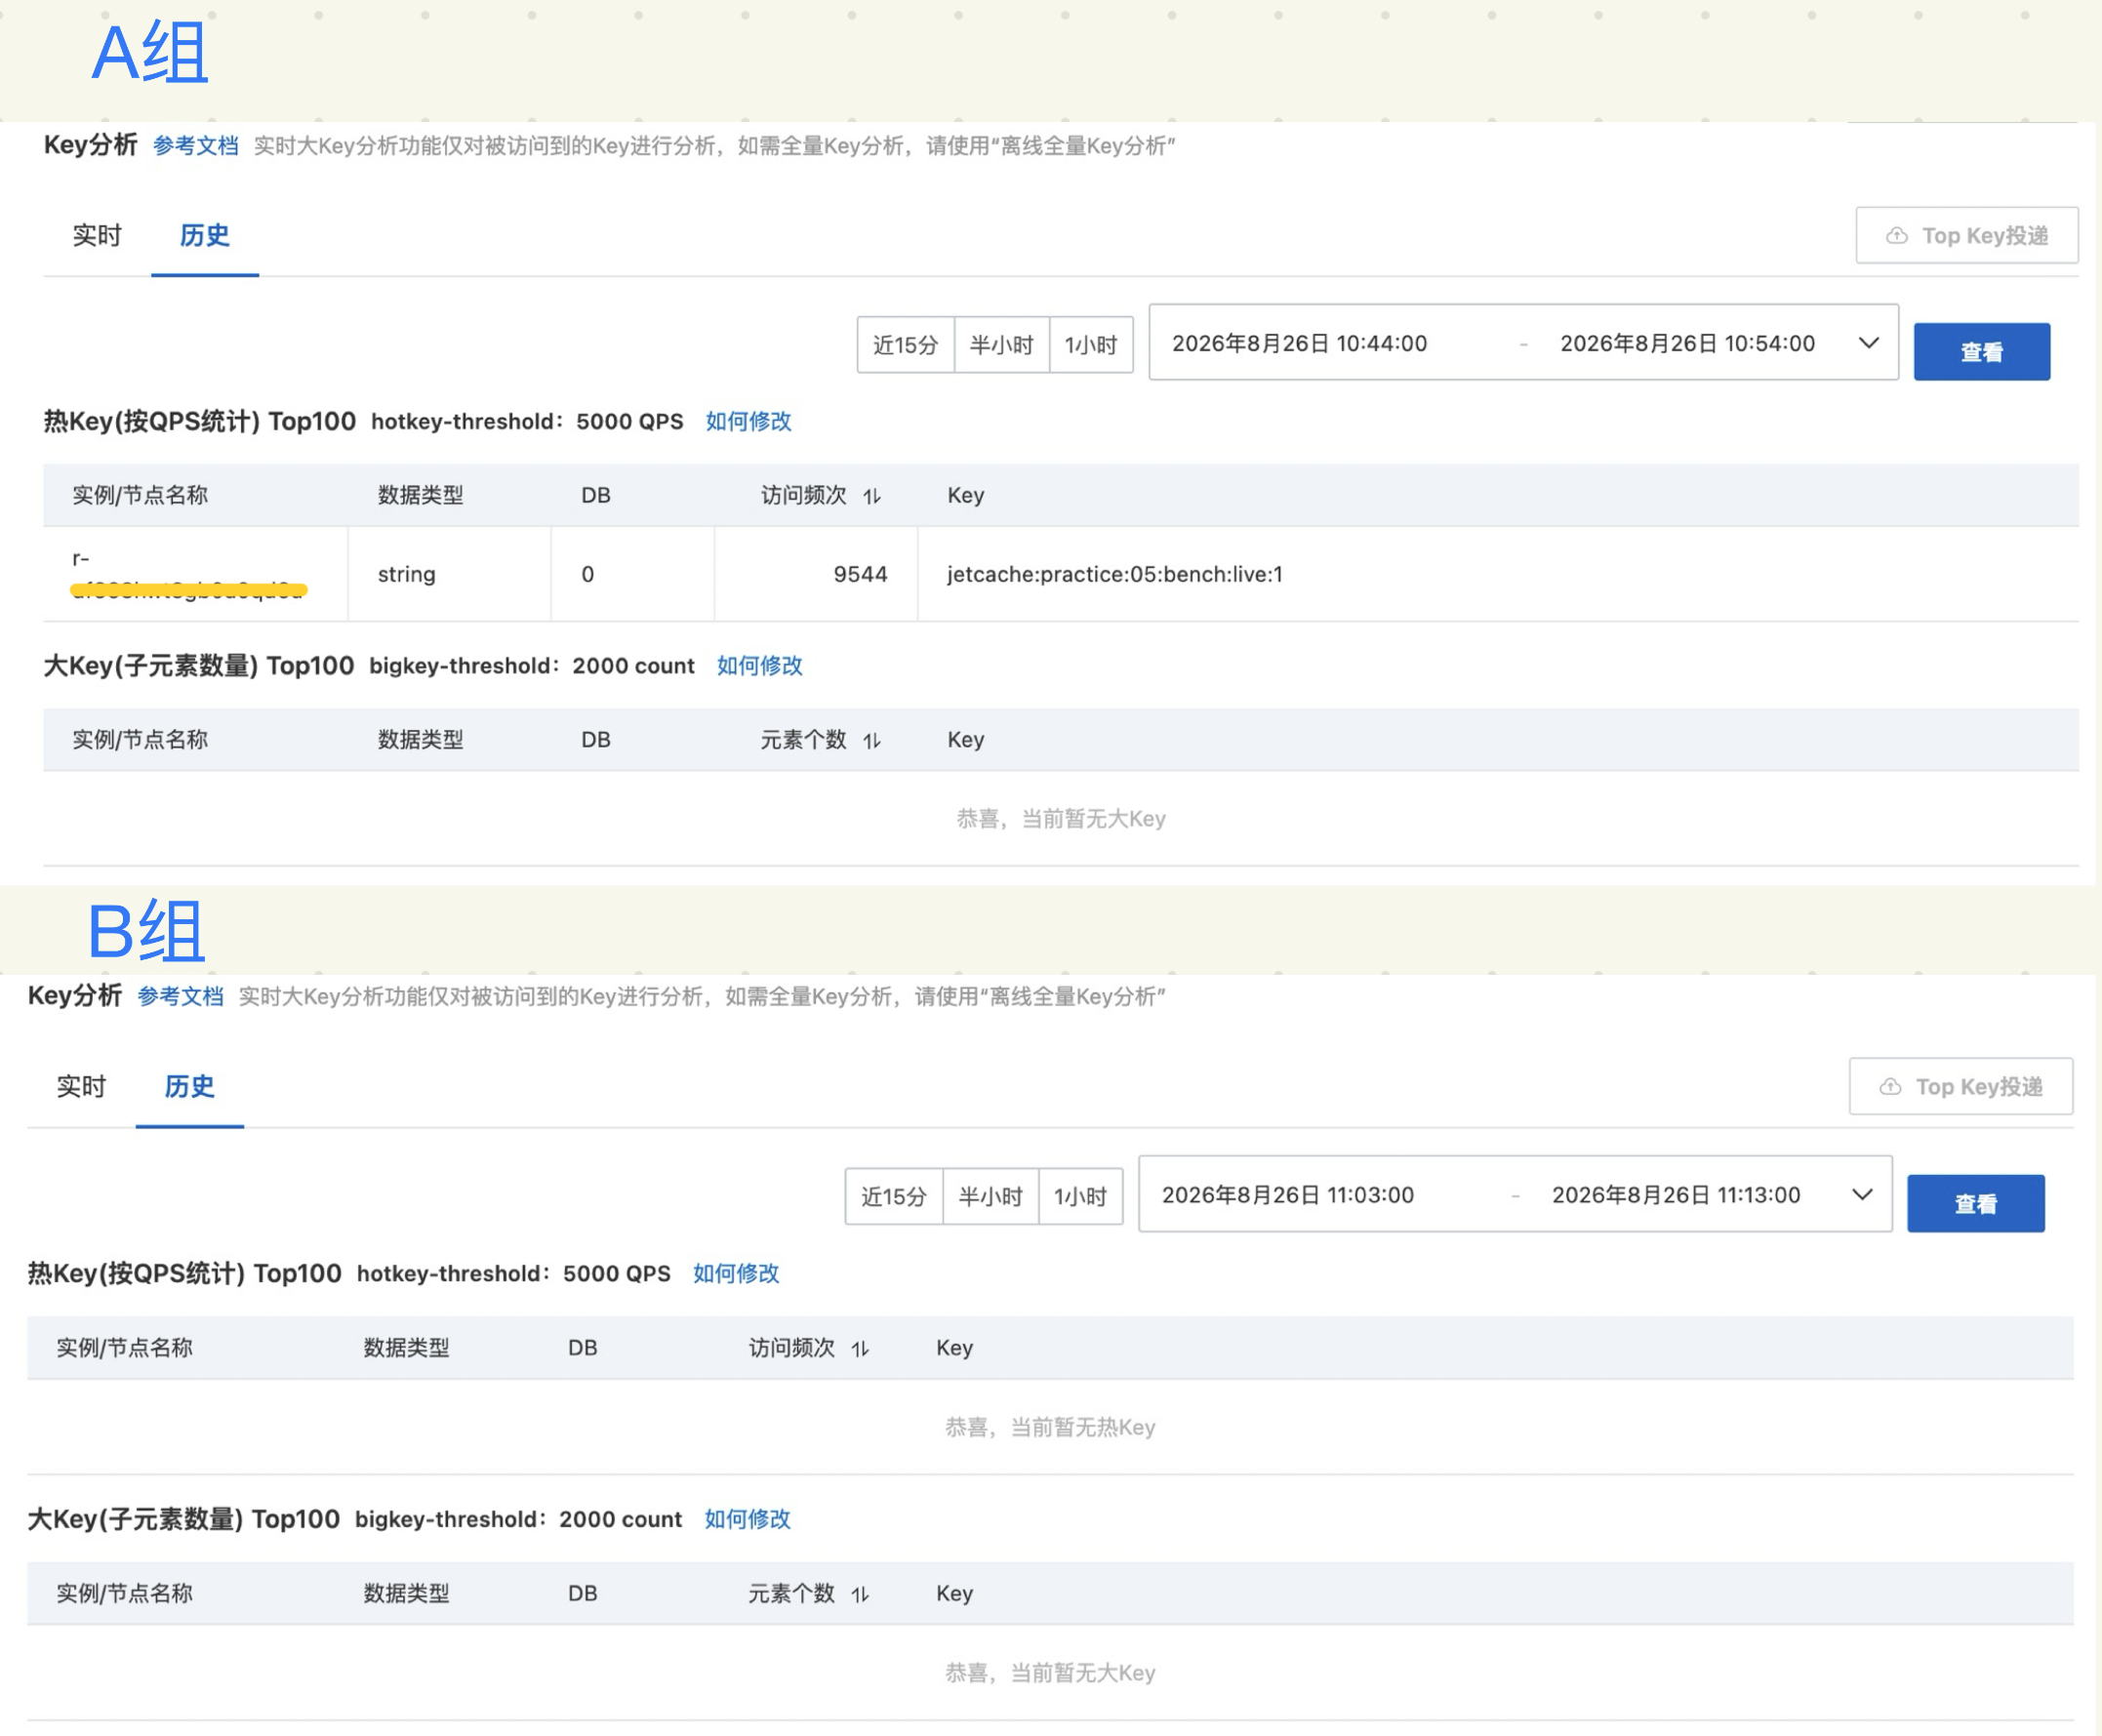
A/B 组在同一硬件环境下依次执行,压测过程中,实时观测应用 QPS、错误情况、HTTP 平均响应时间、Tomcat Busy 线程数、CPU 使用率与负载情况、堆内存、GC 暂停时间等。重点观察 Redis QPS、CPU 与带宽以及是否出现热 key。
结果对比
| 指标 | A 组(仅 Redis 缓存) | B 组(二级缓存) | 优化幅度 |
|---|---|---|---|
| 接口平均响应时间 | 20.4 ms | 0.4 ms | ↓ 98% |
| 吞吐量(QPS) | 9306.85 | 9086.17 | 基本持平 |
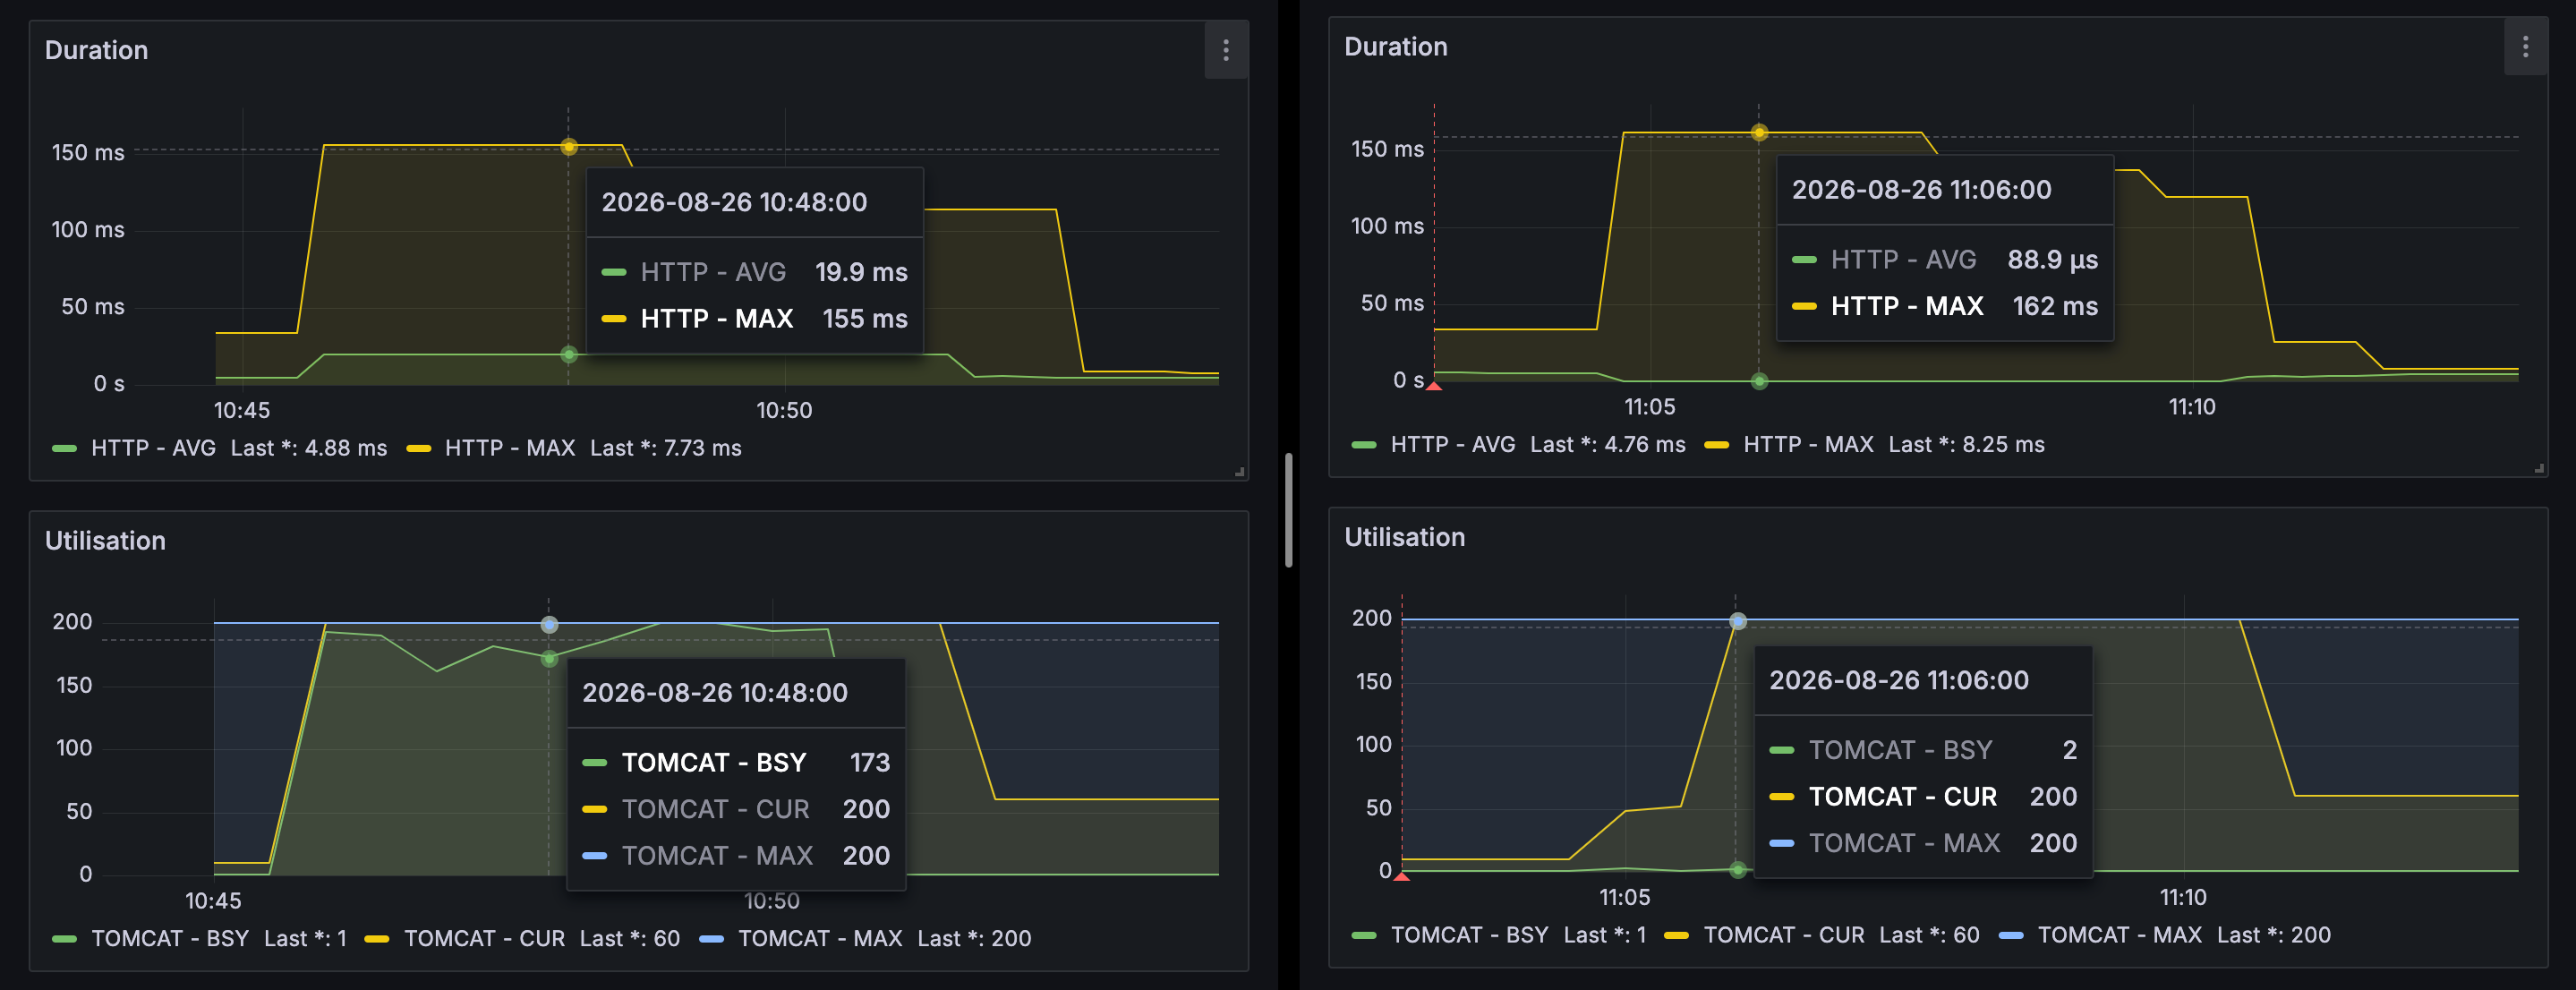
| 业务平均处理时长 | 19.9 ms | 88.9 µs | ↓ 99.6% |
| Tomcat 峰值 Busy 线程 | 200 | 3 | ↓ 98.5% |
| 应用峰值 CPU | 15.9% | 10.7% | ↓ 5.2 pp |
| 应用峰值 Load | 7.8 | 6.5 | ↓ 16.7% |
| GC 暂停时间 | 无压力 | 无压力 | - |
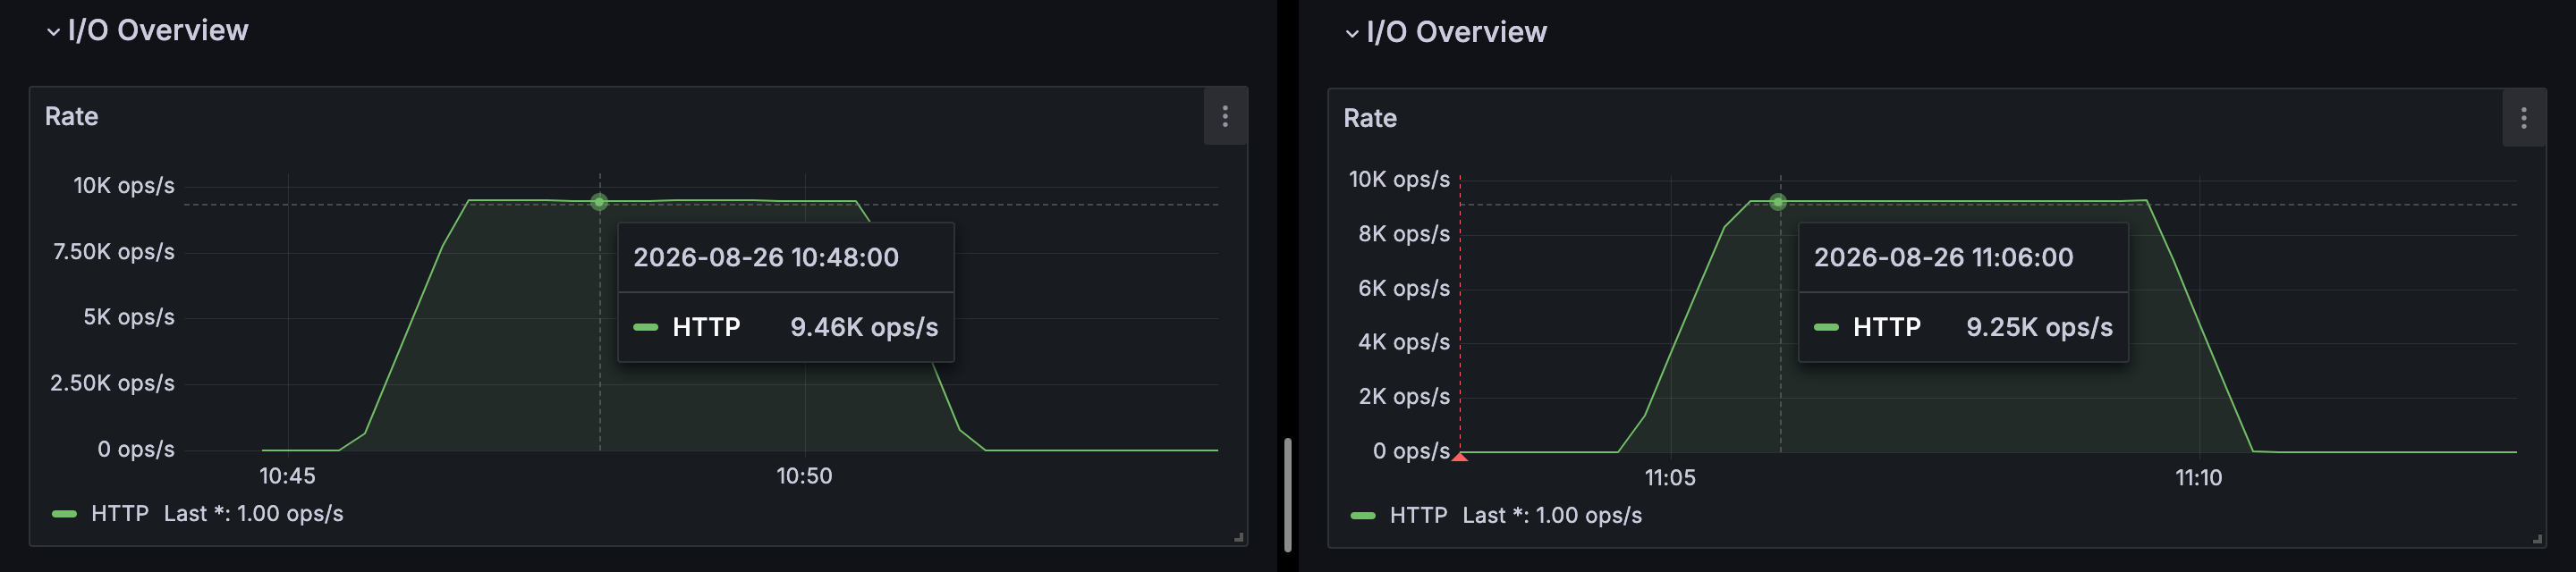
| Redis QPS | 9.49K | 33.9 | ↓ 99.6% |
| Redis 峰值 CPU | 2.99% | 0.237% | ↓ 92% |
| Redis 出口带宽 | 1.43 MiB/s | 39.7 KiB/s | ↓ 97% |
| Redis 热 key | 出现热 key | 未出现热 key | 消灭热 key |
压测报告
应用 QPS
应用 HTTP响应时间、Tomcat busy 线程
应用 CPU 和负载
应用 GC 暂停时间
Redis QPS

Redis CPU 和带宽
热 key
jetcache 日志
2026-08-26T11:04:59.997+08:00  INFO 2601 --- [DefaultExecutor] c.alicp.jetcache.support.StatInfoLogger  : jetcache stat from 2026-08-26 11:04:00,001 to 2026-08-26 11:04:59,994
cache                            |       qps|   rate|           get|           hit|          fail|        expire|avgLoadTime|maxLoadTime
---------------------------------+----------+-------+--------------+--------------+--------------+--------------+-----------+-----------
practice:05:bench:live:          |  7,736.21|100.00%|       240,743|       240,743|             0|             0|        0.0|          0
practice:05:bench:live:_local    |  7,736.21|100.00%|       240,743|       240,733|             0|             0|        0.0|          0
practice:05:bench:live:_remote   |      0.32|100.00%|            10|            10|             0|             0|        0.0|          0
practice:05:bench:live:unpopular:|     17.33| 99.60%|           502|           500|             0|             0|       54.0|         54
---------------------------------+----------+-------+--------------+--------------+--------------+--------------+-----------+-----------

2026-08-26T11:05:59.992+08:00  INFO 2601 --- [DefaultExecutor] c.alicp.jetcache.support.StatInfoLogger  : jetcache stat from 2026-08-26 11:04:59,994 to 2026-08-26 11:05:59,991
cache                            |       qps|   rate|           get|           hit|          fail|        expire|avgLoadTime|maxLoadTime
---------------------------------+----------+-------+--------------+--------------+--------------+--------------+-----------+-----------
practice:05:bench:live:          |  9,227.51|100.00%|       553,623|       553,623|             0|             0|        0.0|          0
practice:05:bench:live:_local    |  9,227.48| 99.96%|       553,621|       553,422|             0|             0|        0.0|          0
practice:05:bench:live:_remote   |      3.32|100.00%|           199|           199|             0|             0|        0.0|          0
practice:05:bench:live:unpopular:|     19.80|100.00%|         1,188|         1,188|             0|             0|        0.0|          0
---------------------------------+----------+-------+--------------+--------------+--------------+--------------+-----------+-----------

2026-08-26T11:06:59.991+08:00  INFO 2601 --- [DefaultExecutor] c.alicp.jetcache.support.StatInfoLogger  : jetcache stat from 2026-08-26 11:05:59,991 to 2026-08-26 11:06:59,988
cache                            |       qps|   rate|           get|           hit|          fail|        expire|avgLoadTime|maxLoadTime
---------------------------------+----------+-------+--------------+--------------+--------------+--------------+-----------+-----------
practice:05:bench:live:          |  9,232.56| 99.97%|       553,926|       553,734|             0|             0|        0.0|          0
practice:05:bench:live:_local    |  9,232.56| 99.96%|       553,926|       553,728|             0|             0|        0.0|          0
practice:05:bench:live:_remote   |      3.30|  3.03%|           198|             6|             0|             0|        0.0|          0
practice:05:bench:live:unpopular:|     19.65|100.00%|         1,179|         1,179|             0|             0|        0.0|          0
---------------------------------+----------+-------+--------------+--------------+--------------+--------------+-----------+-----------

2026-08-26T11:07:59.987+08:00  INFO 2601 --- [DefaultExecutor] c.alicp.jetcache.support.StatInfoLogger  : jetcache stat from 2026-08-26 11:06:59,988 to 2026-08-26 11:07:59,985
cache                            |       qps|   rate|           get|           hit|          fail|        expire|avgLoadTime|maxLoadTime
---------------------------------+----------+-------+--------------+--------------+--------------+--------------+-----------+-----------
practice:05:bench:live:          |  9,215.29| 99.96%|       552,890|       552,689|             0|             0|       55.0|         55
practice:05:bench:live:_local    |  9,215.19| 99.96%|       552,884|       552,683|             0|             1|        0.0|          0
practice:05:bench:live:_remote   |      3.35|  0.00%|           201|             0|             0|             0|        0.0|          0
practice:05:bench:live:unpopular:|     19.73|100.00%|         1,184|         1,184|             0|             0|        0.0|          0
---------------------------------+----------+-------+--------------+--------------+--------------+--------------+-----------+-----------

2026-08-26T11:08:59.983+08:00  INFO 2601 --- [DefaultExecutor] c.alicp.jetcache.support.StatInfoLogger  : jetcache stat from 2026-08-26 11:07:59,985 to 2026-08-26 11:08:59,982
cache                            |       qps|   rate|           get|           hit|          fail|        expire|avgLoadTime|maxLoadTime
---------------------------------+----------+-------+--------------+--------------+--------------+--------------+-----------+-----------
practice:05:bench:live:          |  9,215.68| 99.96%|       552,913|       552,712|             0|             0|       55.0|         55
practice:05:bench:live:_local    |  9,215.68| 99.93%|       552,913|       552,525|             0|             0|        0.0|          0
practice:05:bench:live:_remote   |      6.47| 48.20%|           388|           187|             0|             0|        0.0|          0
practice:05:bench:live:unpopular:|     19.67|100.00%|         1,180|         1,180|             0|             0|        0.0|          0
---------------------------------+----------+-------+--------------+--------------+--------------+--------------+-----------+-----------

2026-08-26T11:09:59.988+08:00  INFO 2601 --- [DefaultExecutor] c.alicp.jetcache.support.StatInfoLogger  : jetcache stat from 2026-08-26 11:08:59,982 to 2026-08-26 11:09:59,983
cache                            |       qps|   rate|           get|           hit|          fail|        expire|avgLoadTime|maxLoadTime
---------------------------------+----------+-------+--------------+--------------+--------------+--------------+-----------+-----------
practice:05:bench:live:          |  4,428.03|100.00%|       265,686|       265,686|             0|             0|        0.0|          0
practice:05:bench:live:_local    |  4,428.03| 99.93%|       265,686|       265,490|             0|             1|        0.0|          0
practice:05:bench:live:_remote   |      3.27|100.00%|           196|           196|             0|             0|        0.0|          0
practice:05:bench:live:unpopular:|      9.47|100.00%|           568|           568|             0|             0|        0.0|          0
---------------------------------+----------+-------+--------------+--------------+--------------+--------------+-----------+-----------
分析 jetcache 日志发现,本地缓存平均命中率高达 99.96%,说明二级缓存将绝大部分请求拦截在了本地。
结论
二级缓存核心作用
- 减轻 Redis 压力: 通过将热点请求拦截在本地,减少对 Redis 的访问,从而缓解 Redis 单节点 CPU 和带宽瓶颈。
- 提升吞吐上限: 大部分热点请求直接在 JVM 内存里命中,消除了网络 RTT 开销,业务平均处理时长从毫秒级降至微秒级,显著提升单机吞吐。
基于本次试验数据,Tomcat 最大线程数 200、目标利用率 0.5、业务平均处理时长 88.9 µs 的前提下,根据排队论,单机能承载的理论 QPS 。这仅仅是理论值,真实 QPS 还会受 CPU、GC、业务逻辑、网络等限制,需要进一步压测验证。
- 增强可用性: Redis 短暂抖动时,本地缓存仍可提供降级读服务,提高系统容错能力。
如何通过业务平均处理时长反推单机能承载的理论 QPS?
根据排队论公式:
可得:
即:
也就是:
需要注意的代价
- 数据一致性: 多节点本地缓存会出现短暂不一致窗口,需配合消息广播(如 Redis Pub/Sub)主动失效本地缓存 + TTL 兜底。
- 内存占用: 每个应用节点都持有一份副本,需控制缓存规模,避免挤占业务堆内存。
- 适用边界: 仅适合读多写少、容忍短暂不一致的热点数据;强一致或高频更新的数据不建议放入二级缓存。
延伸
为了验证在 Tomcat 最大线程数 200、目标利用率 0.5、业务平均处理时长 88.9 µs 的前提下,单机能否承载 1,124,859 QPS,我们针对二级缓存进行一轮压力测试。
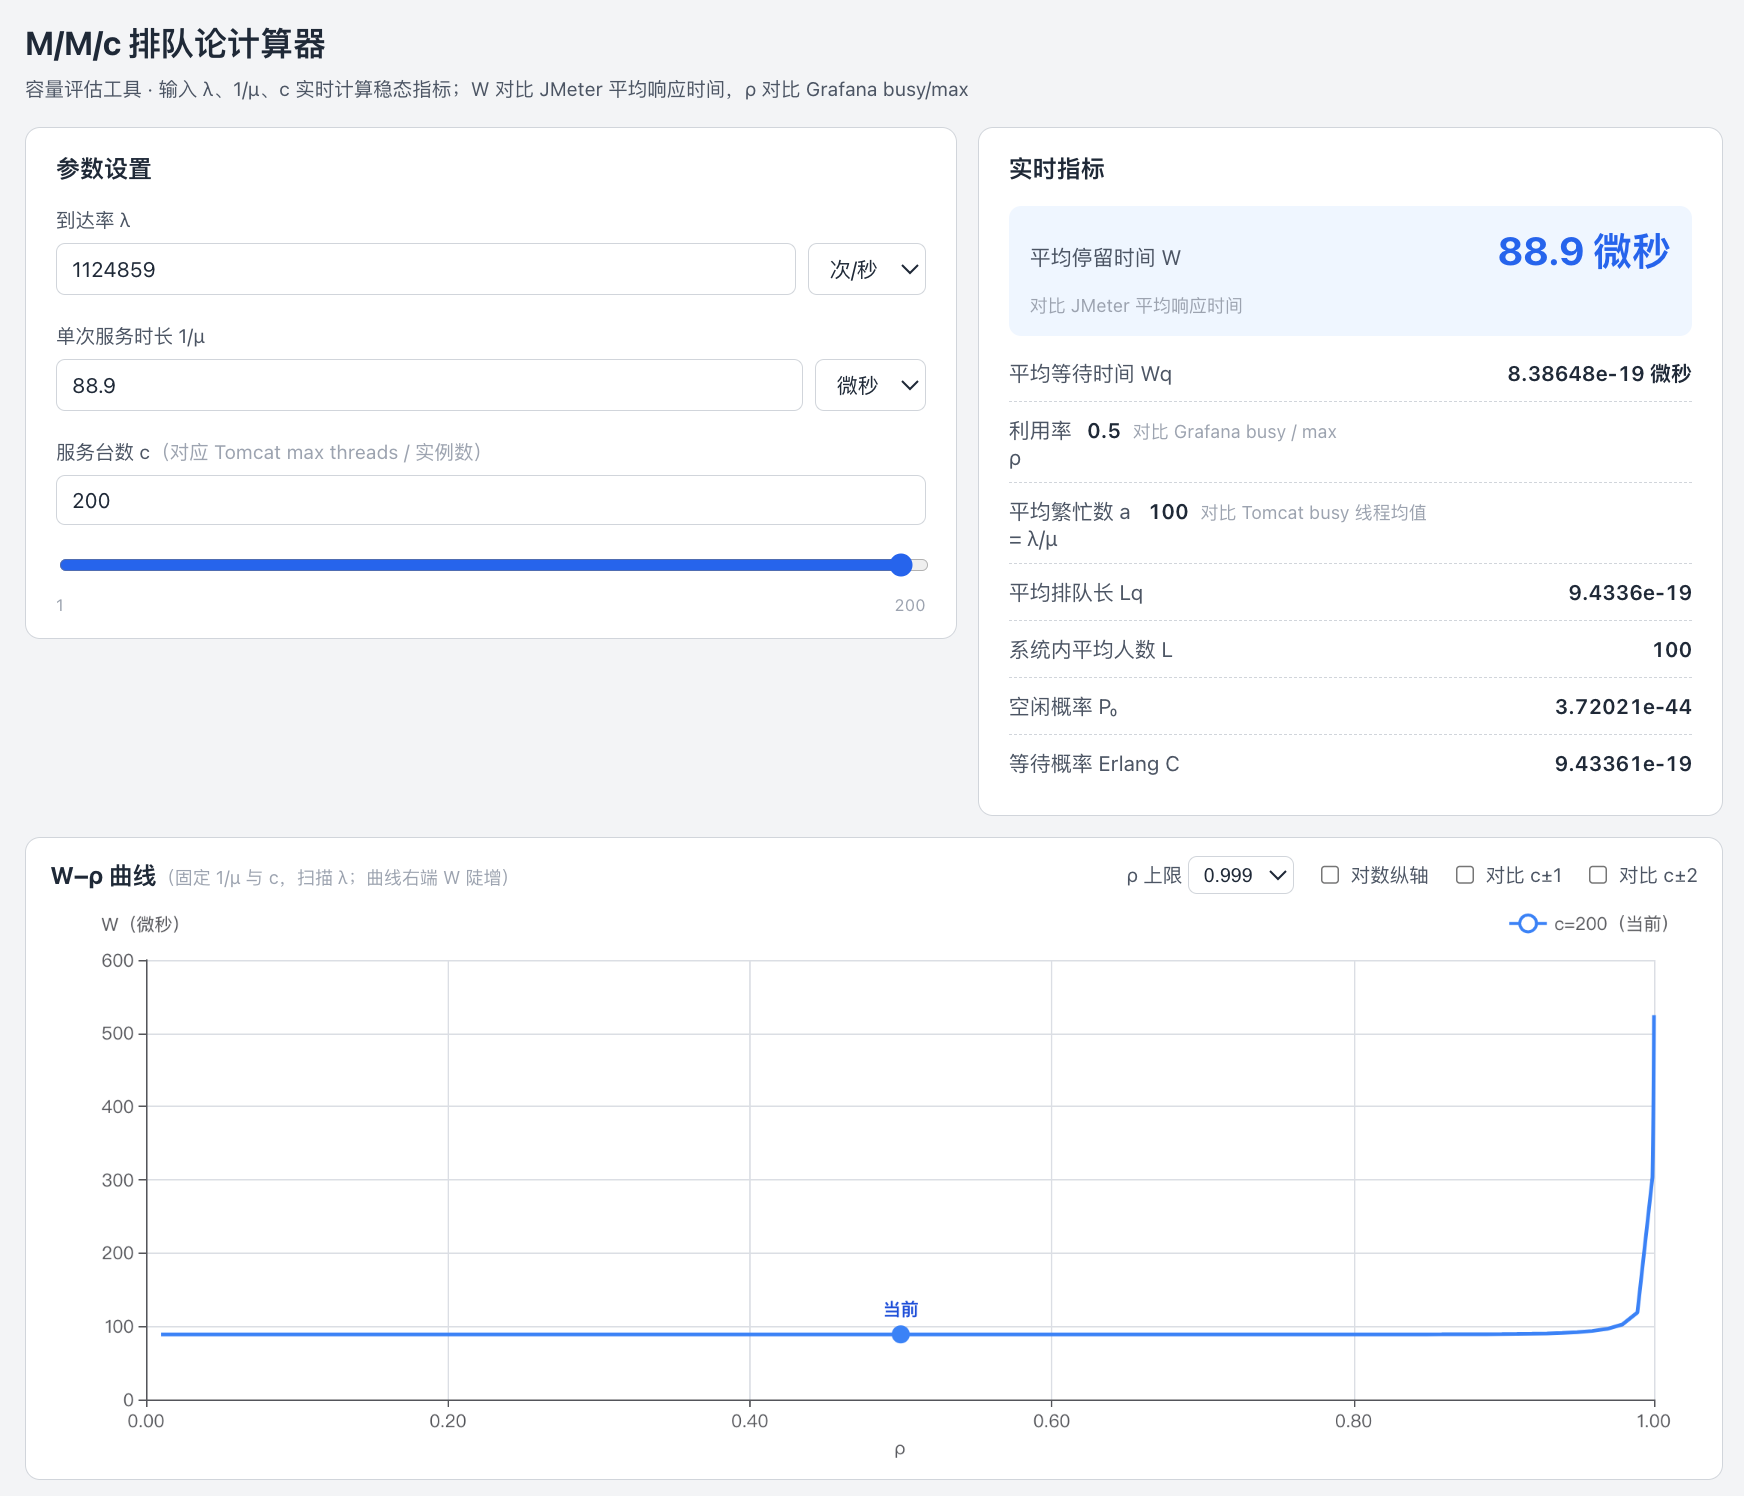
将目标 QPS 1,124,859 代入 M/M/c 排队论计算器,得出: 平均停留时间 W = 88.9 µs
说明
由于单机 JMeter 资源限制,为了跑出较高的 QPS,故舍去热门商品观众的思考时间。
热门商品观众数
冷门商品观众数
二级缓存压力测试计划:
recommend-product-mixed-test:
  热门商品观众线程组: 100个用户,10秒爬坡,持续5分钟
    - 获取直播间推荐商品
  助理线程组: 1个用户,1秒爬坡,持续5分钟
    - 定时2分钟(浮动1秒)
    - 清除直播间推荐商品缓存
  冷门商品观众线程组: 40个用户,10秒爬坡,持续5分钟
    - 定时2秒(浮动200毫秒)
- 查询冷门商品压力测试结果:
| 指标 | 压力测试结果 |
|---|---|
| 理论目标 QPS | 1,124,859 |
| 实际平均 QPS | 77,235 |
| 实际峰值 QPS | 80,400 |
| Tomcat 峰值 Busy / Max | 7 / 200 |
| 稳态峰值 CPU, 应用 / 系统 | 42.3% / 97.0% |
| GC 暂停时间 | 无压力 |
压测报告:
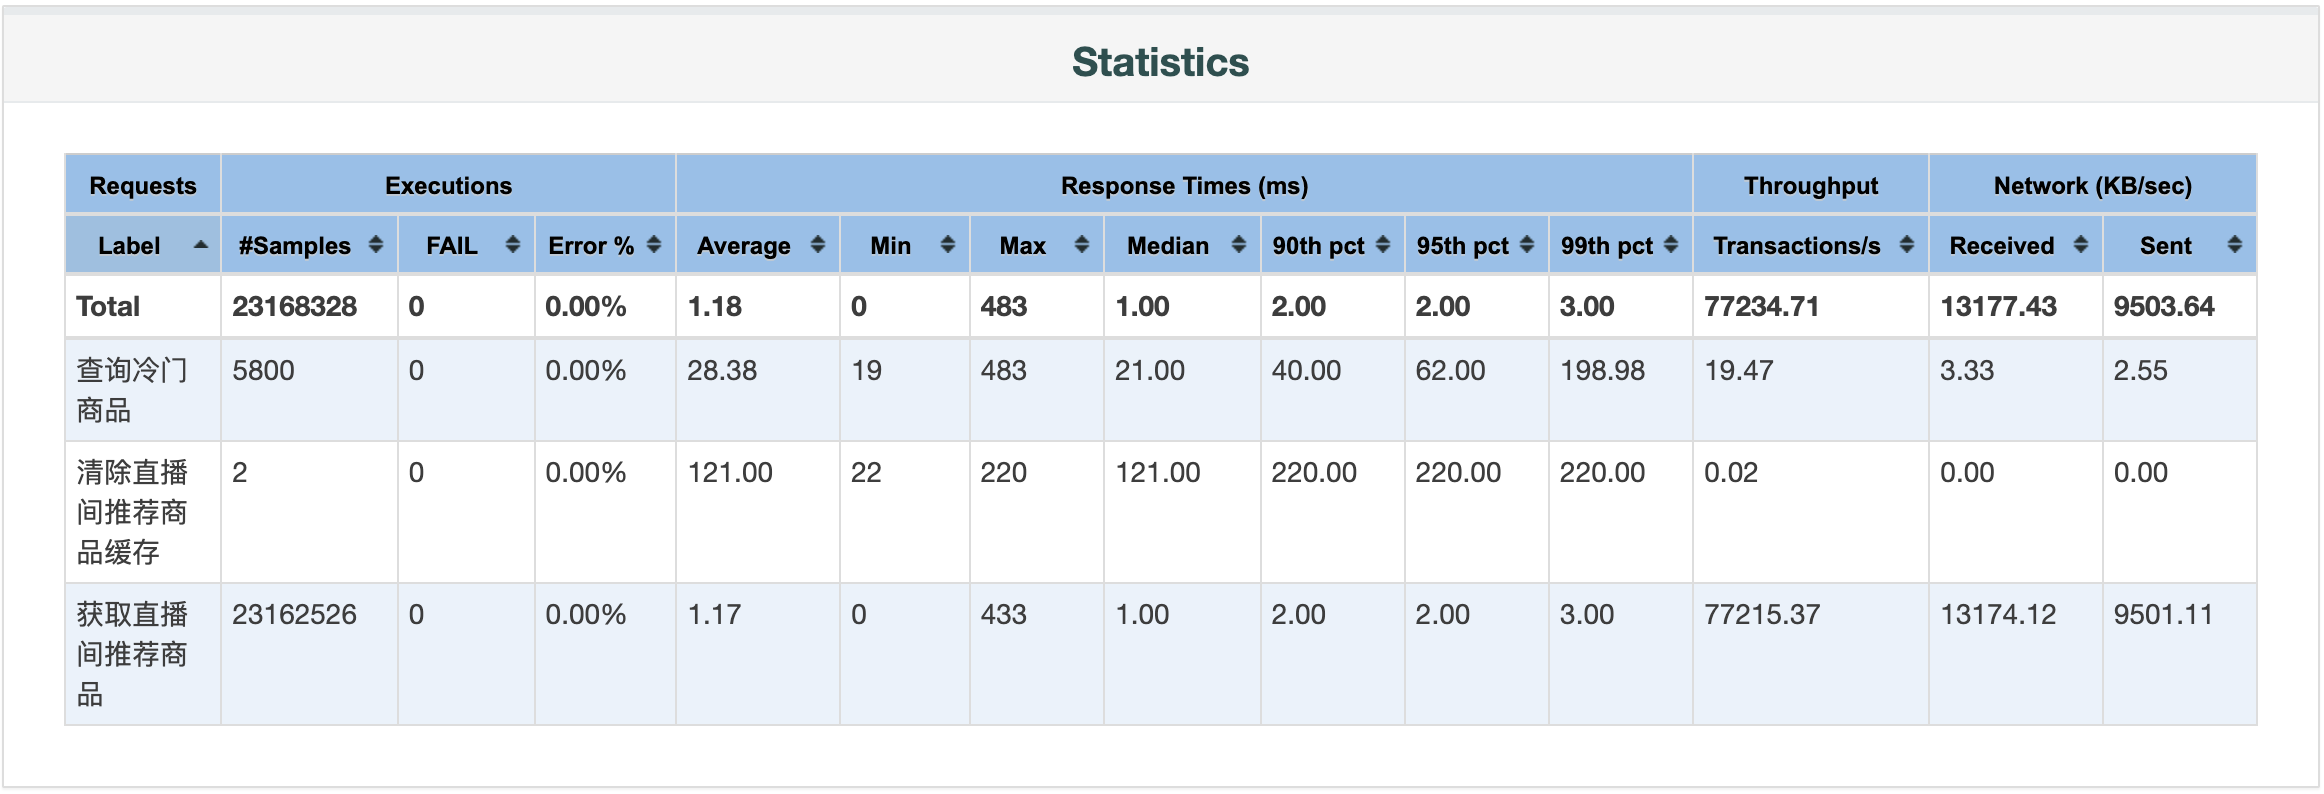
系统指标:
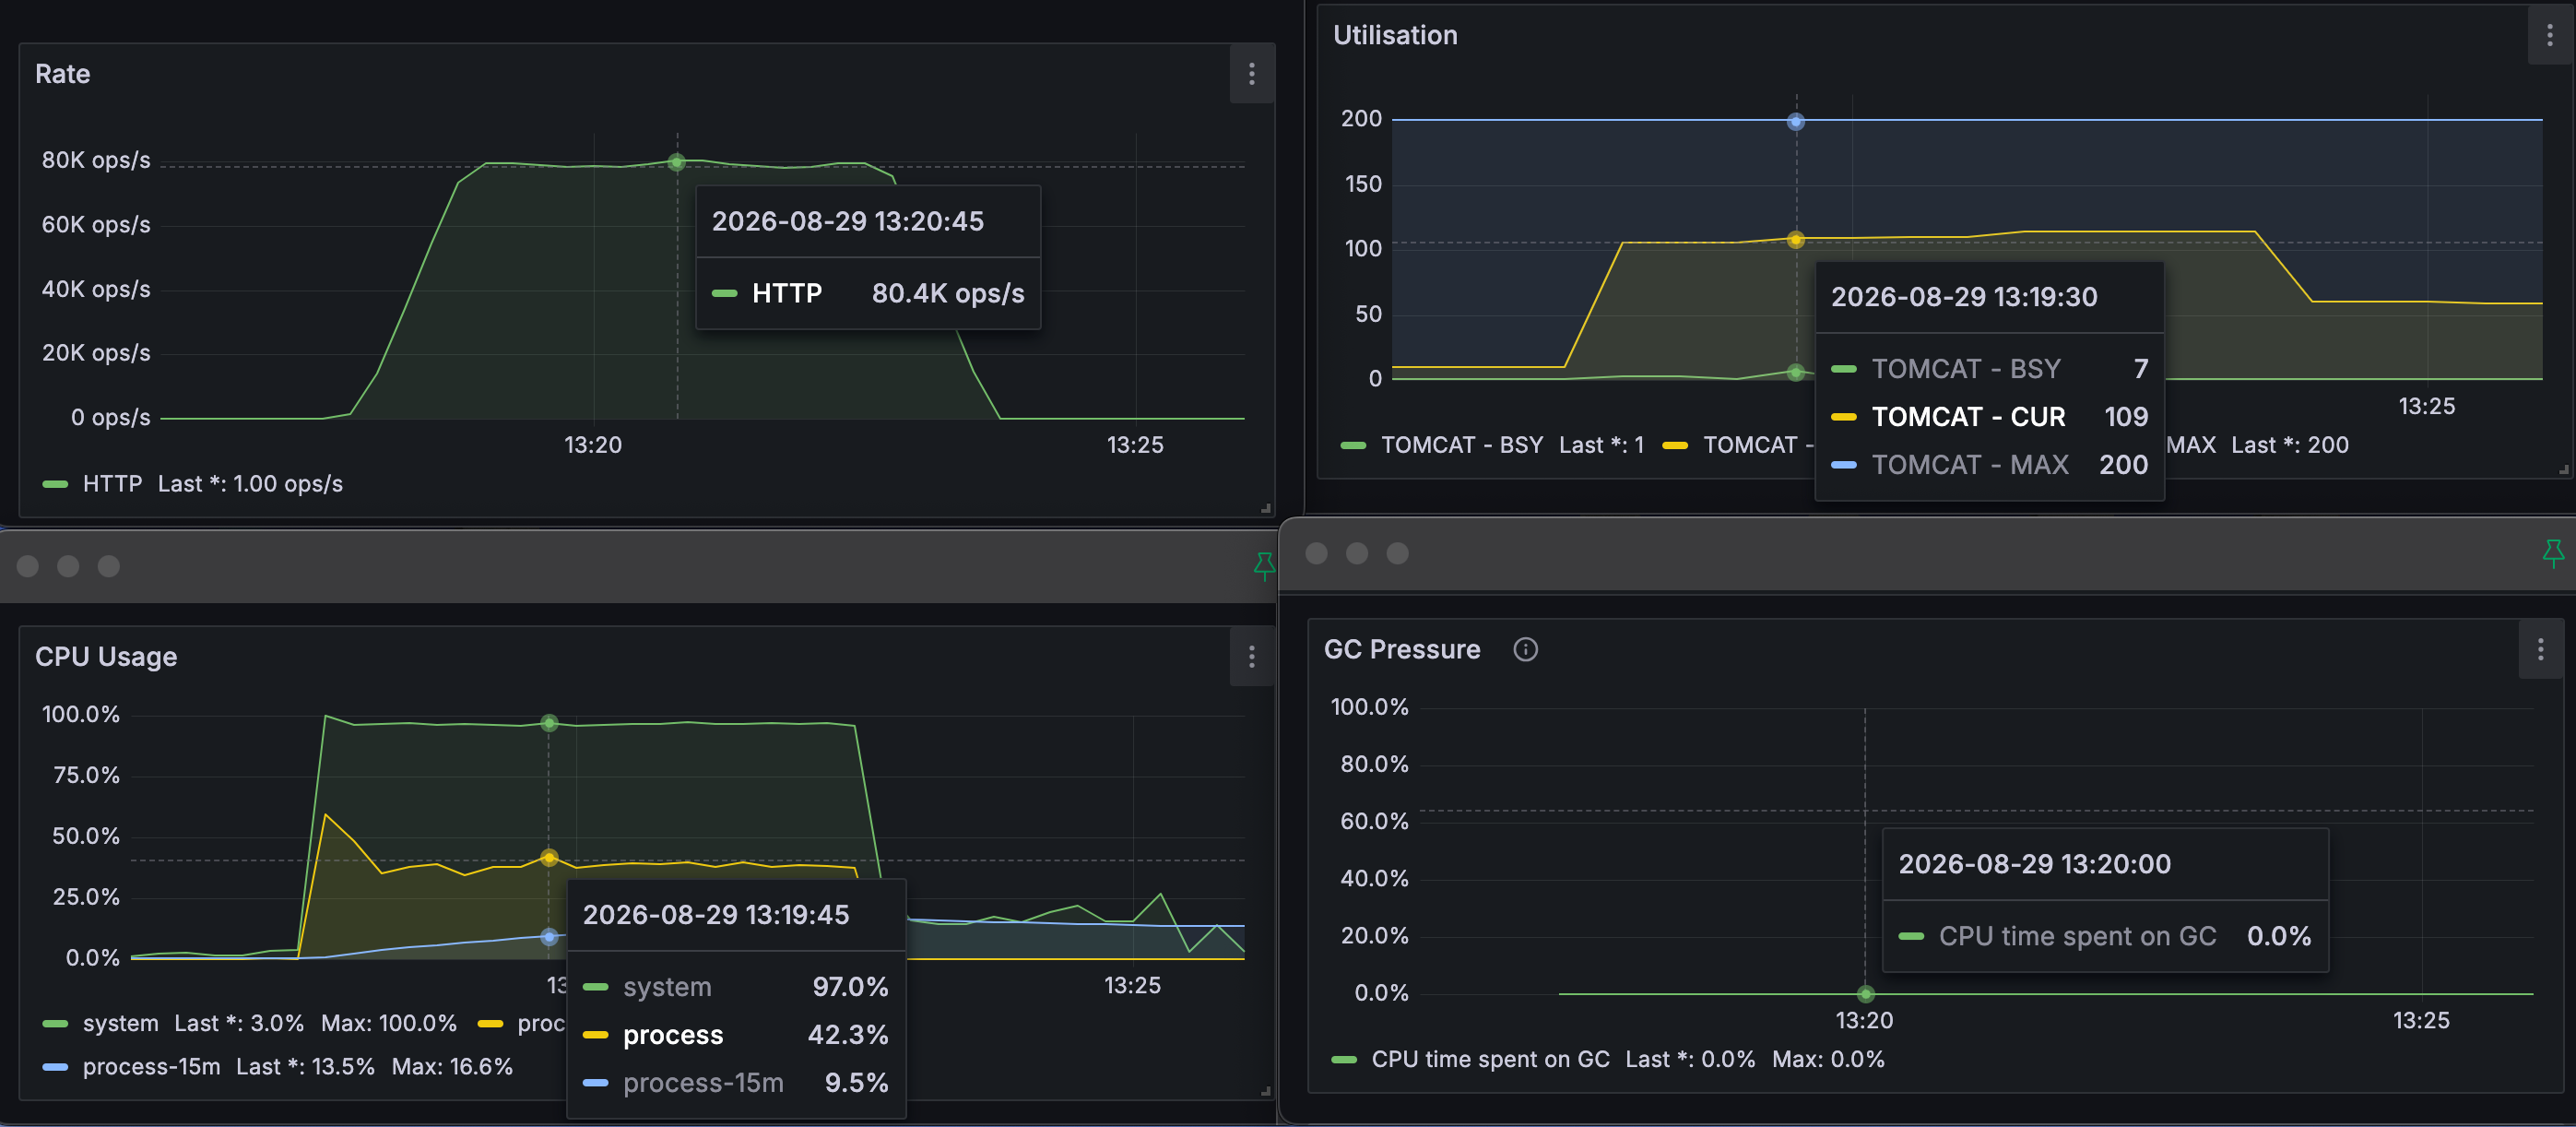
由此可看出应用 Tomcat 线程池不忙,GC 无压力,进程 CPU 仅占 42.3%,但此时系统 CPU 却逼近 100%,考虑到应用和 JMeter 跑在同一台机器,相互之间会竞争 CPU,压测机资源已趋近饱和,因此本次测试主要受限于压测端的发压能力,77,235 QPS 并不代表服务端的实际吞吐上限。